Satellite and other geospatial data also allow us to better understand the evolution and impact of the wildfires on Maui (and in the future, how to anticipate or prevent them). There is an abundance of information online about the fires including satellite data, but it can be hard to sort through everything. On this page, we organize the sources of satellite data related to the fires and share resources for accessing this satellite data and derived products.
The Maui Fires Relief Map is an interactive map to help relay critical information about fire response and recovery resources to the community.
The relief map was created by PLAN Systems; visit this site for more information about the maps including the data sources used for the map and a Google form to contribution new information.
This ArcGIS-based Searchable Visualization Dashboard was created by Christine, a GIS expert and spatial ecologist in Kula. You can use this searchable map to explore the post-fire data, using the slider to see before and after imagery. You can also turn on and off layers (including visually assessed damage, fire perimeter, Hawaiian homelands, historic places, mile markers, and fires/thermal hotspots).
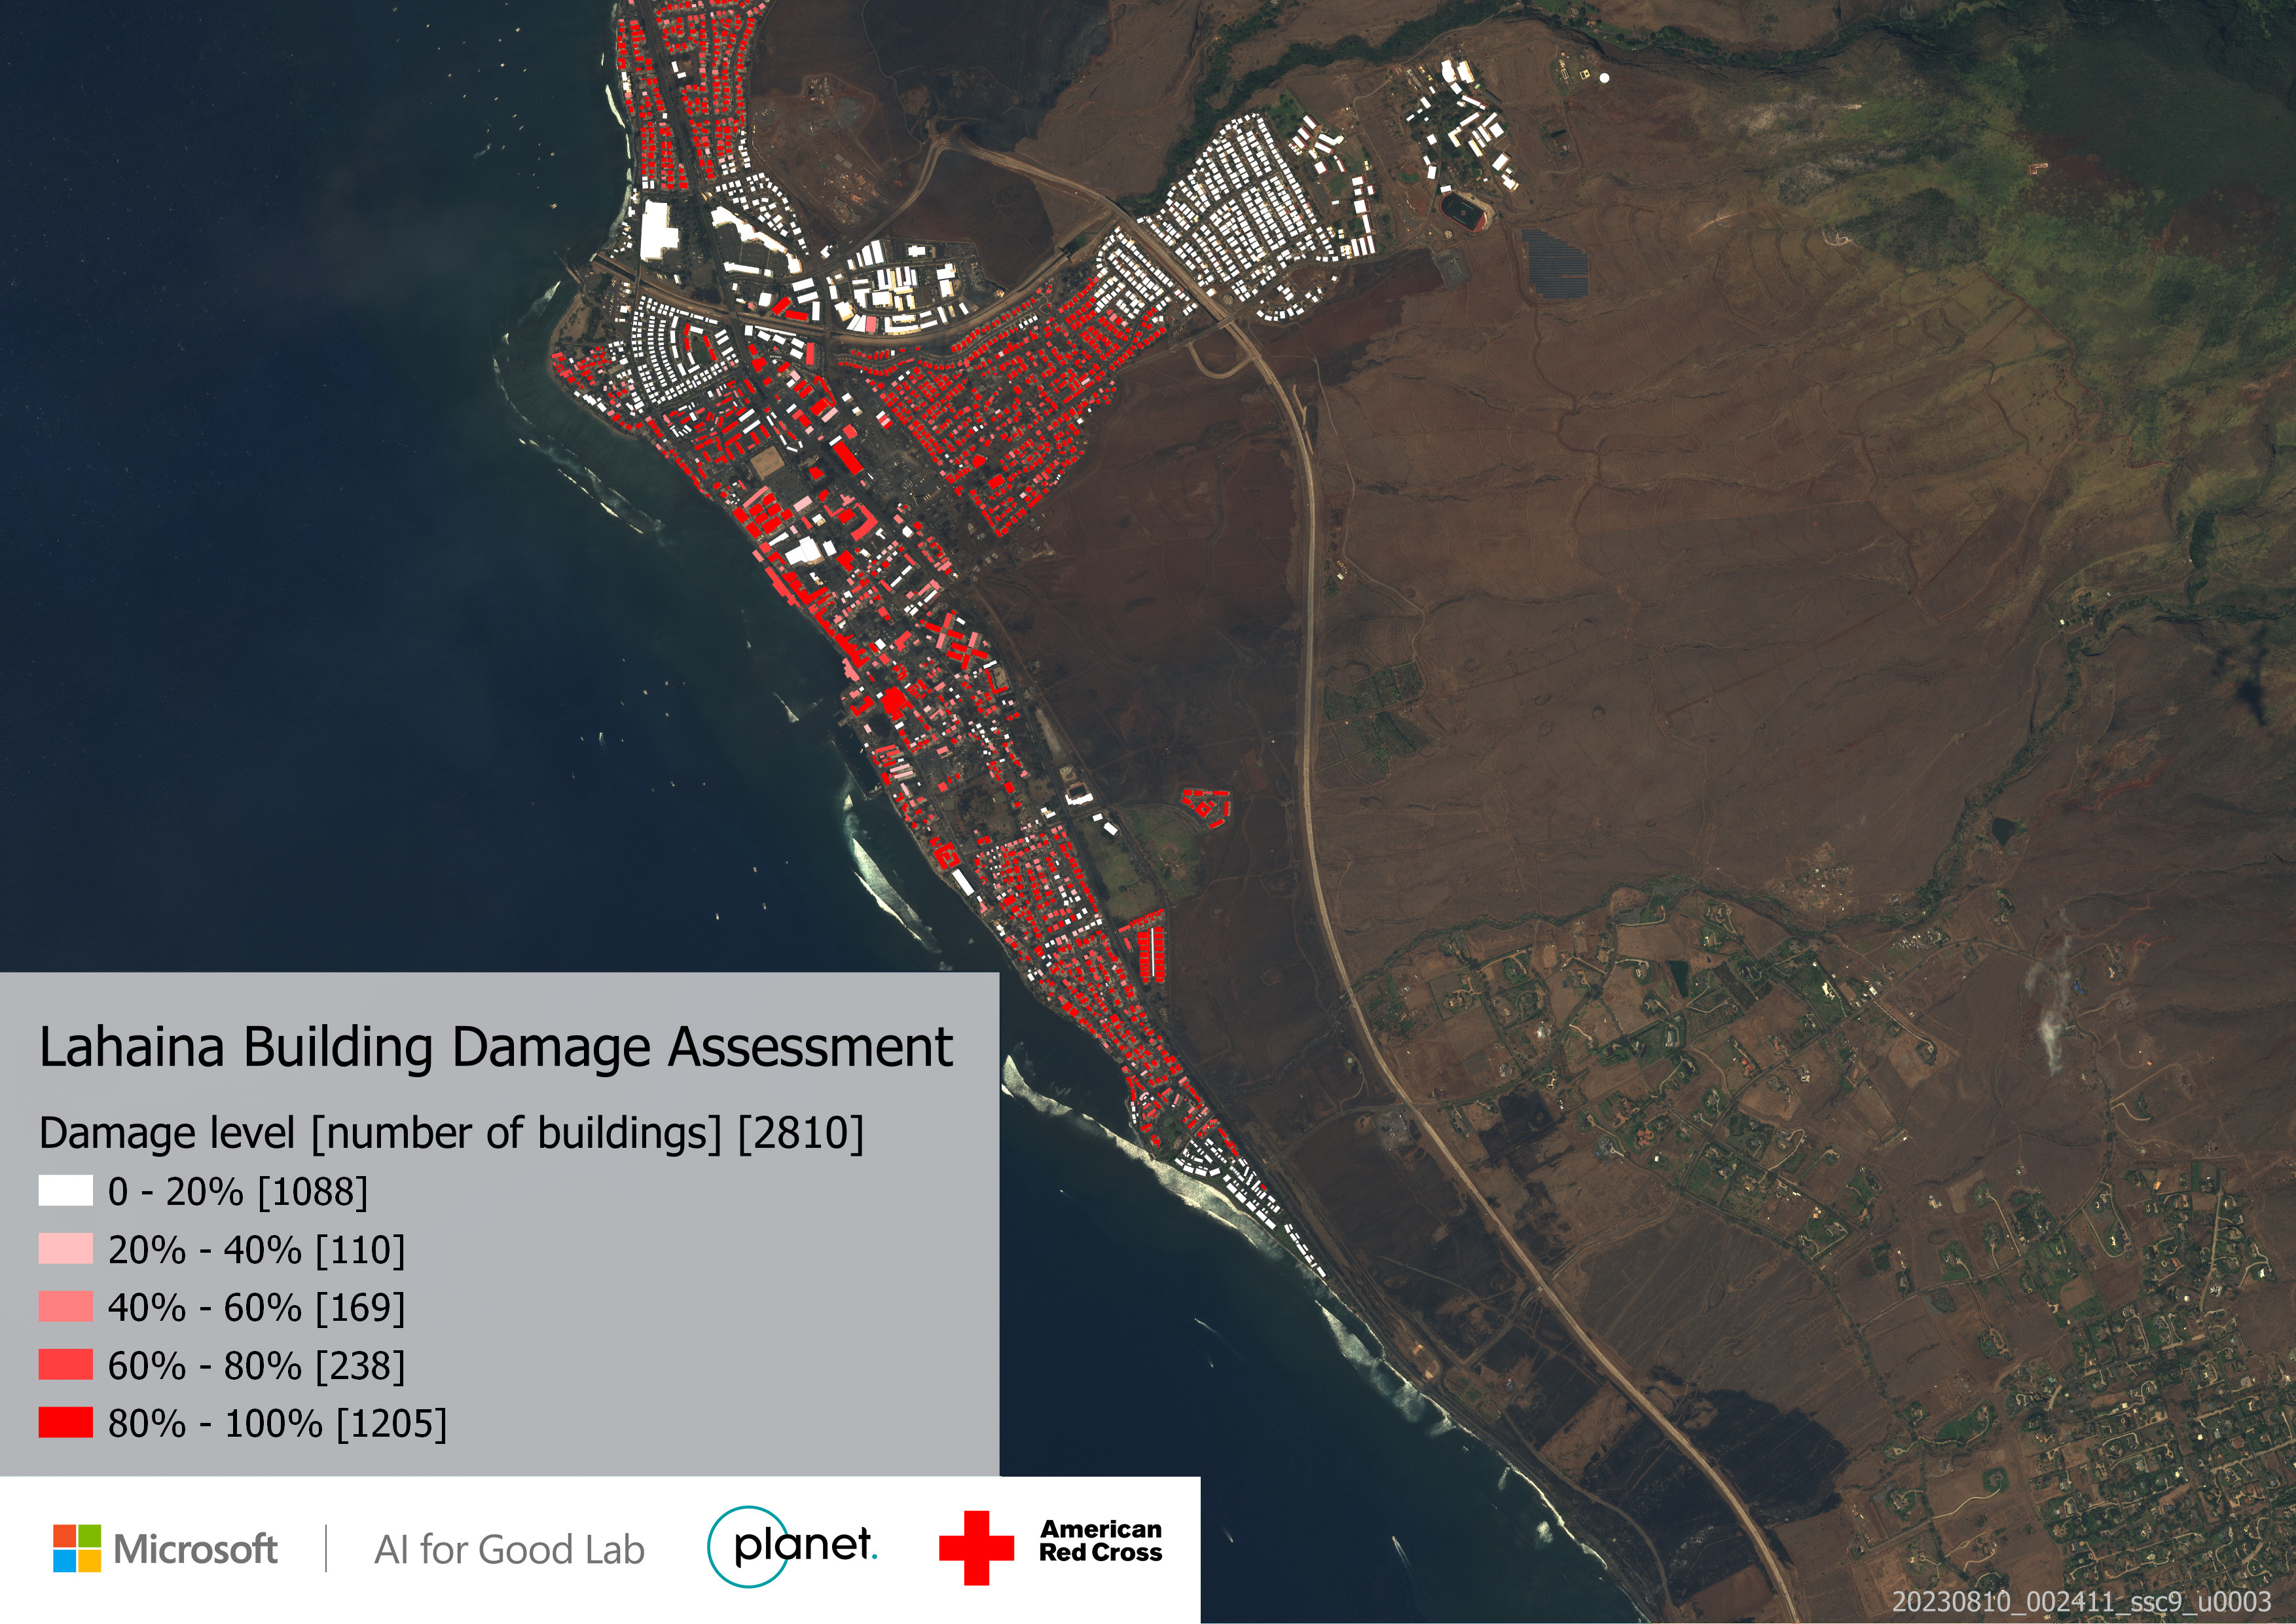
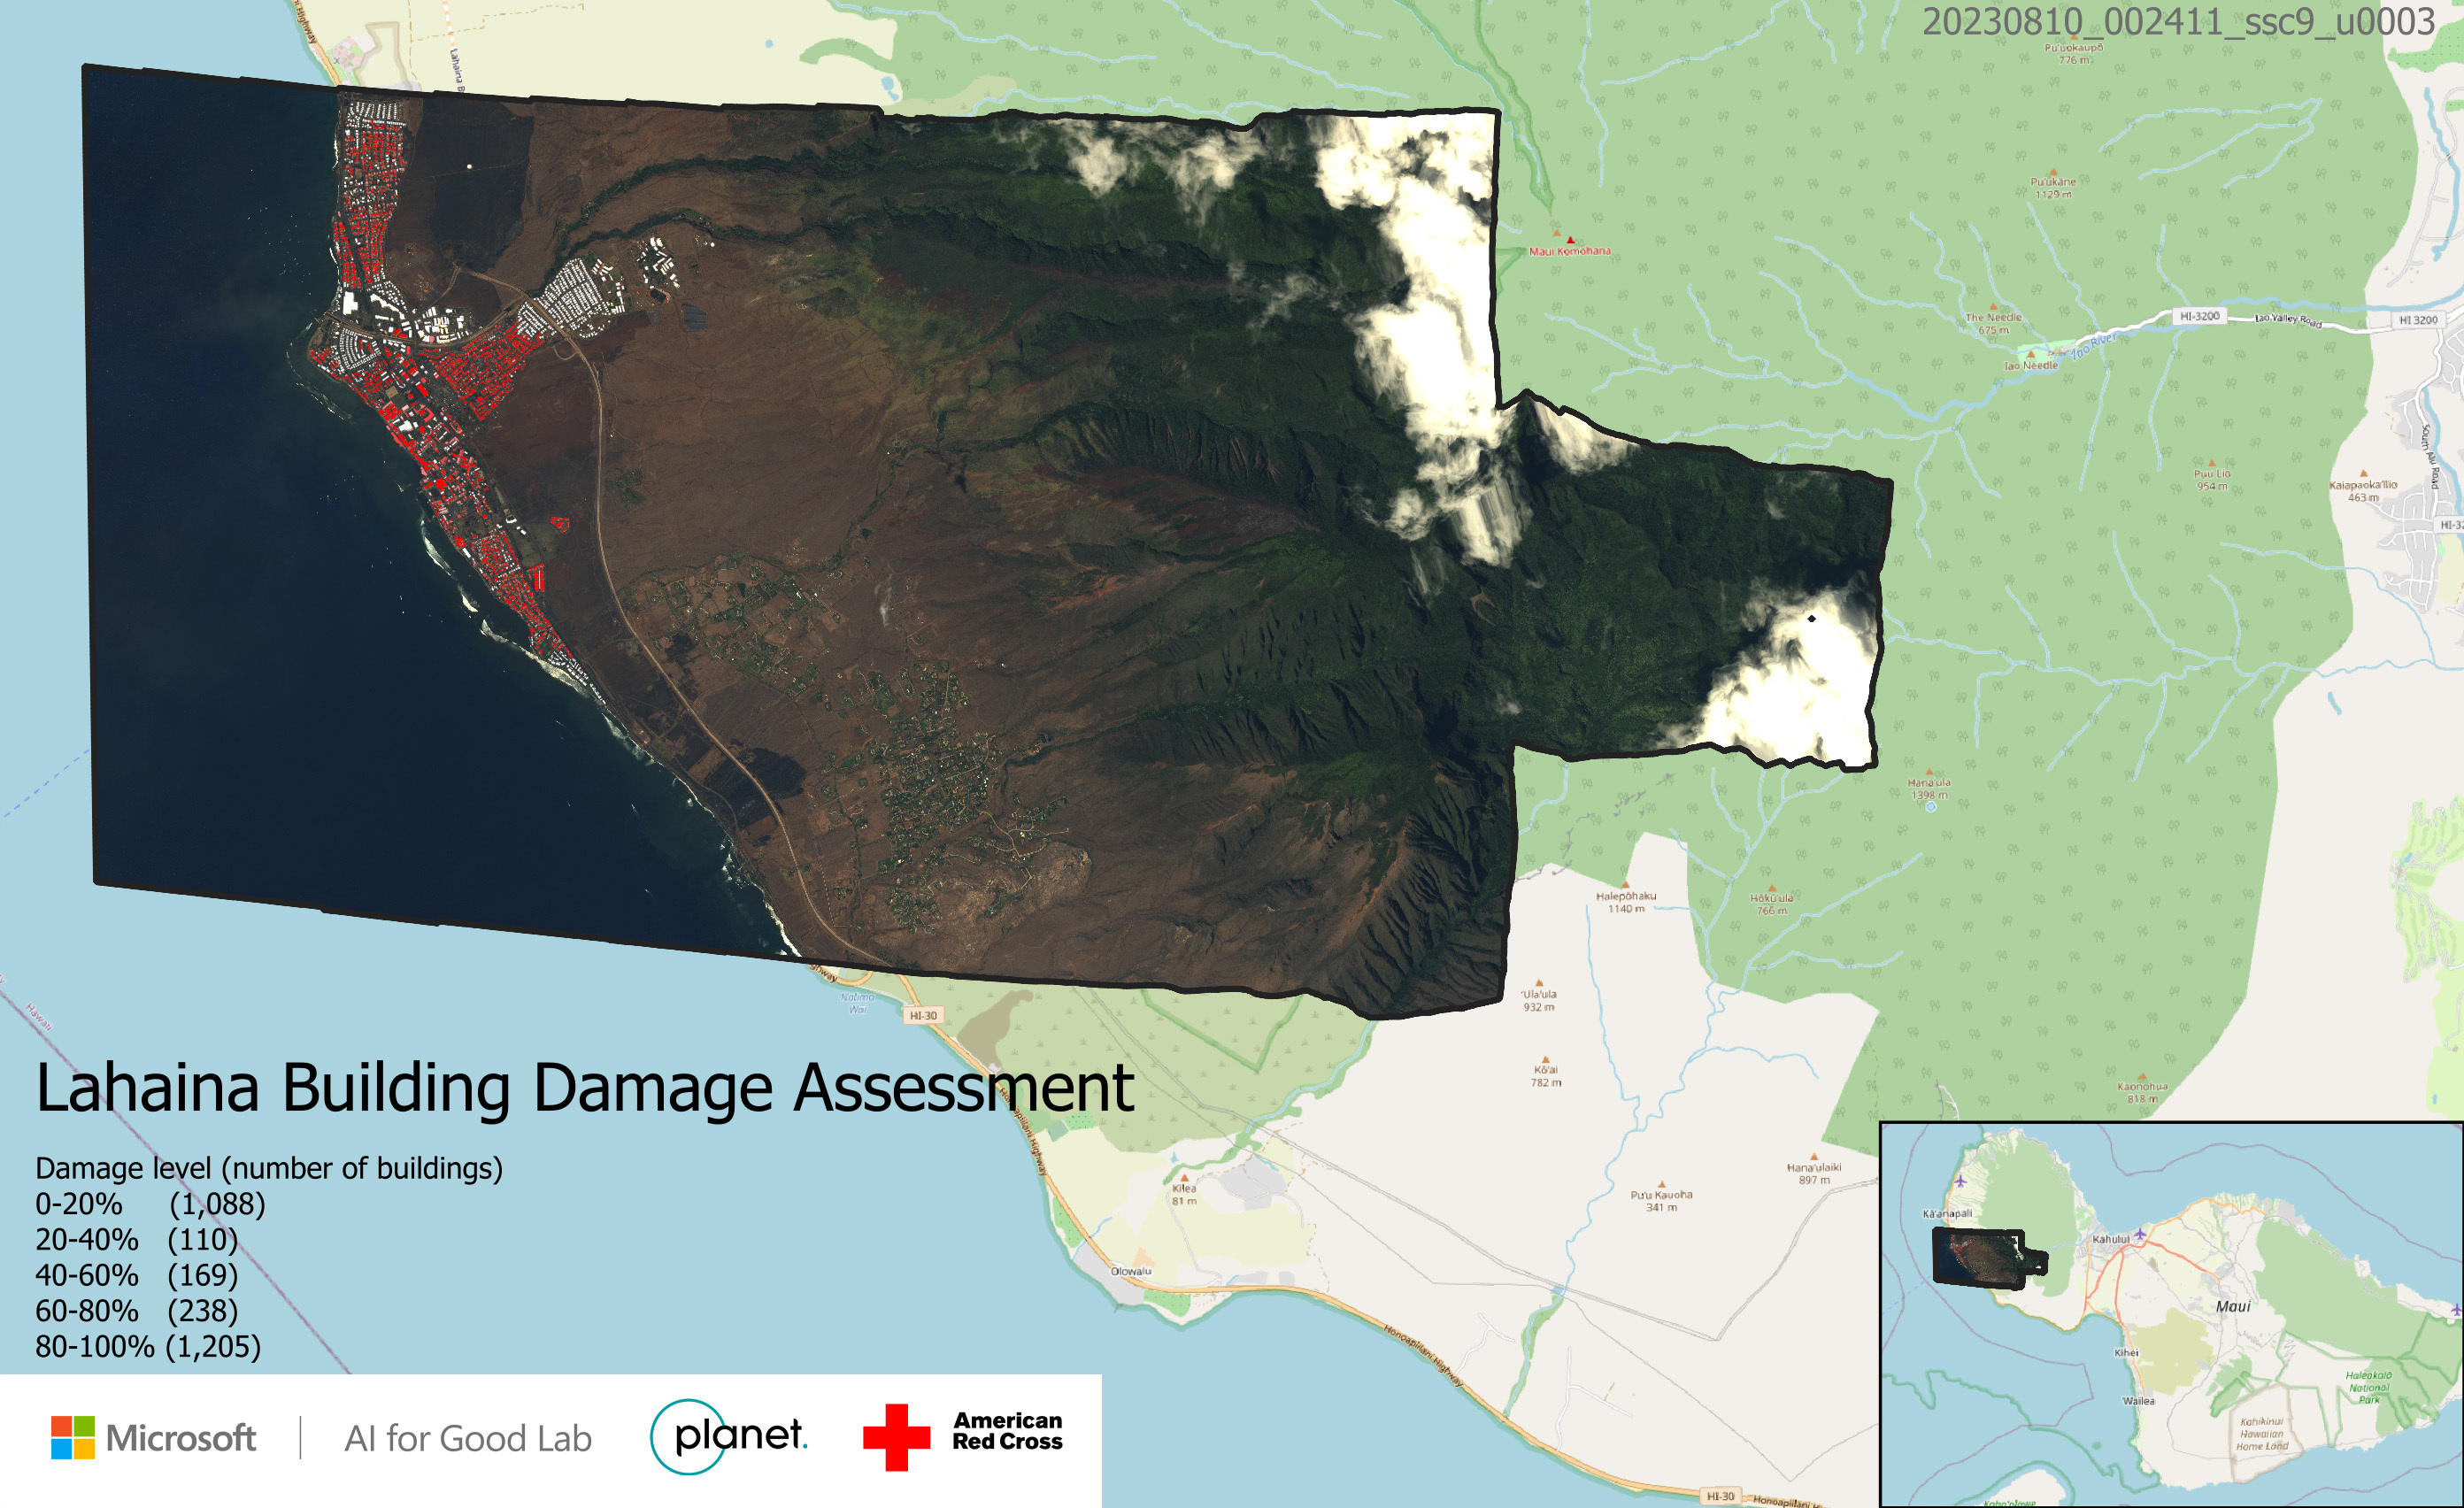
The Microsoft AI for Good geospatial team used machine learning and very high resolution satellite imagery from Planet Inc's SkySat satellite constellation to identify damaged buildings in Lahaina following the wildfires.
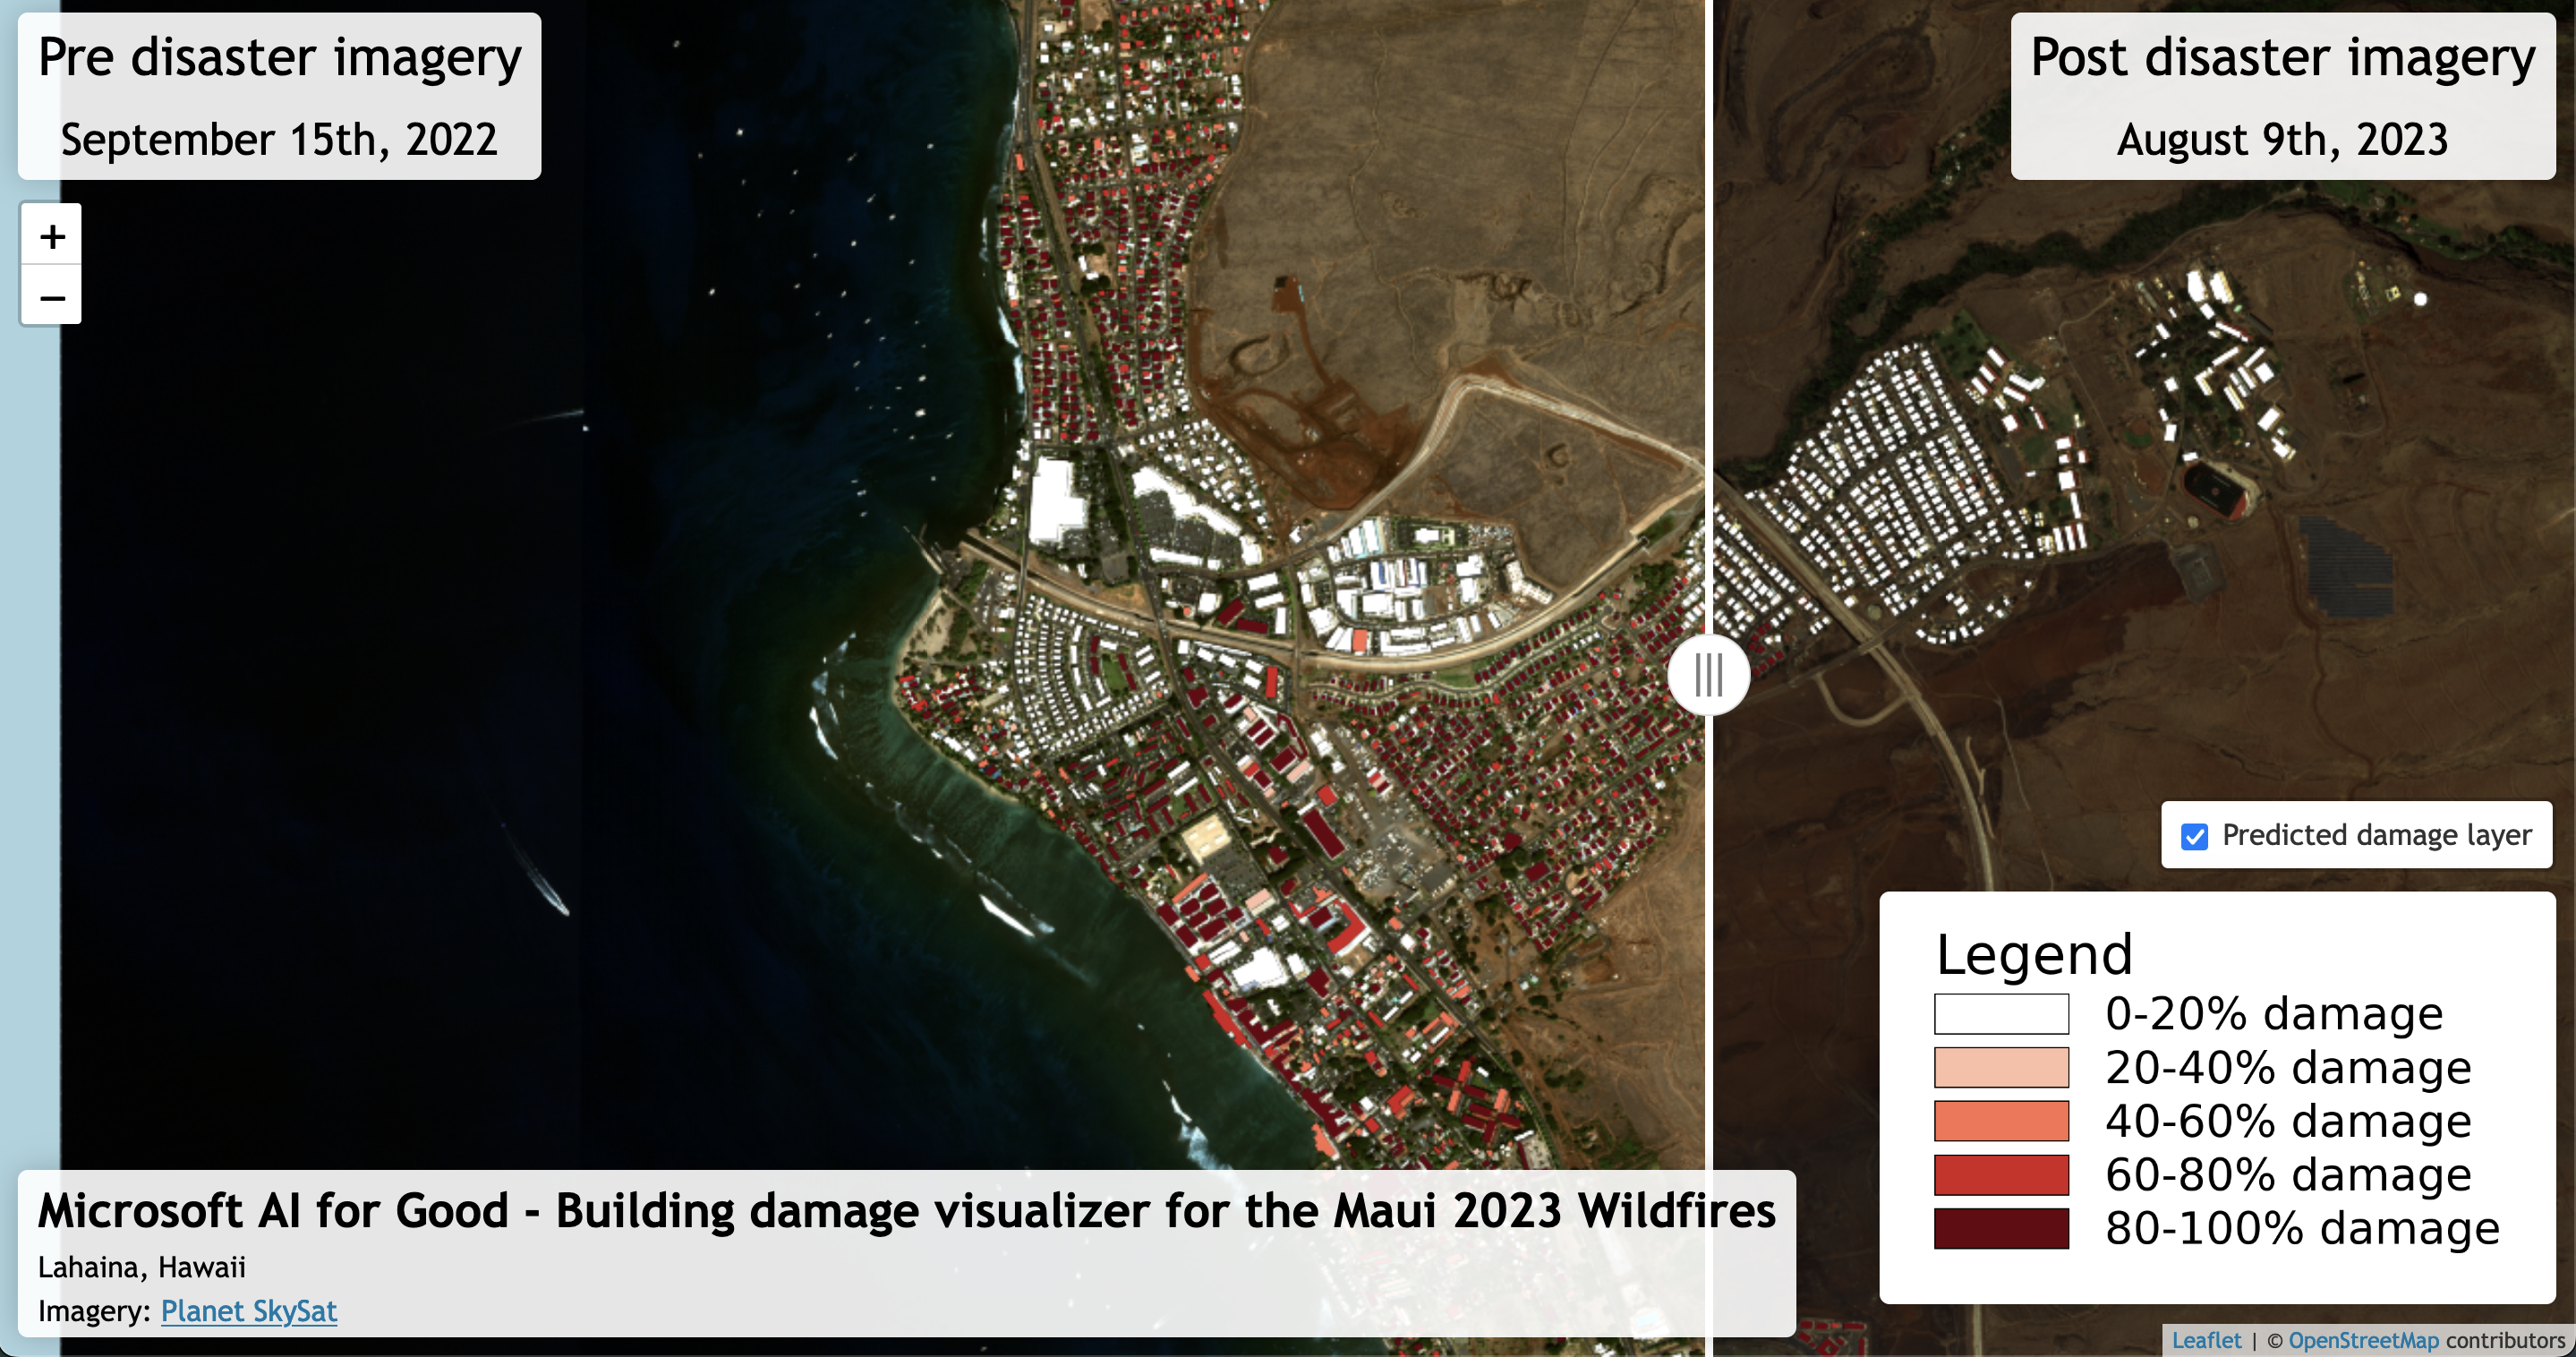
You can use this visualization tool to explore before and after satellite images of Lahaina and see the detections of building damage levels.
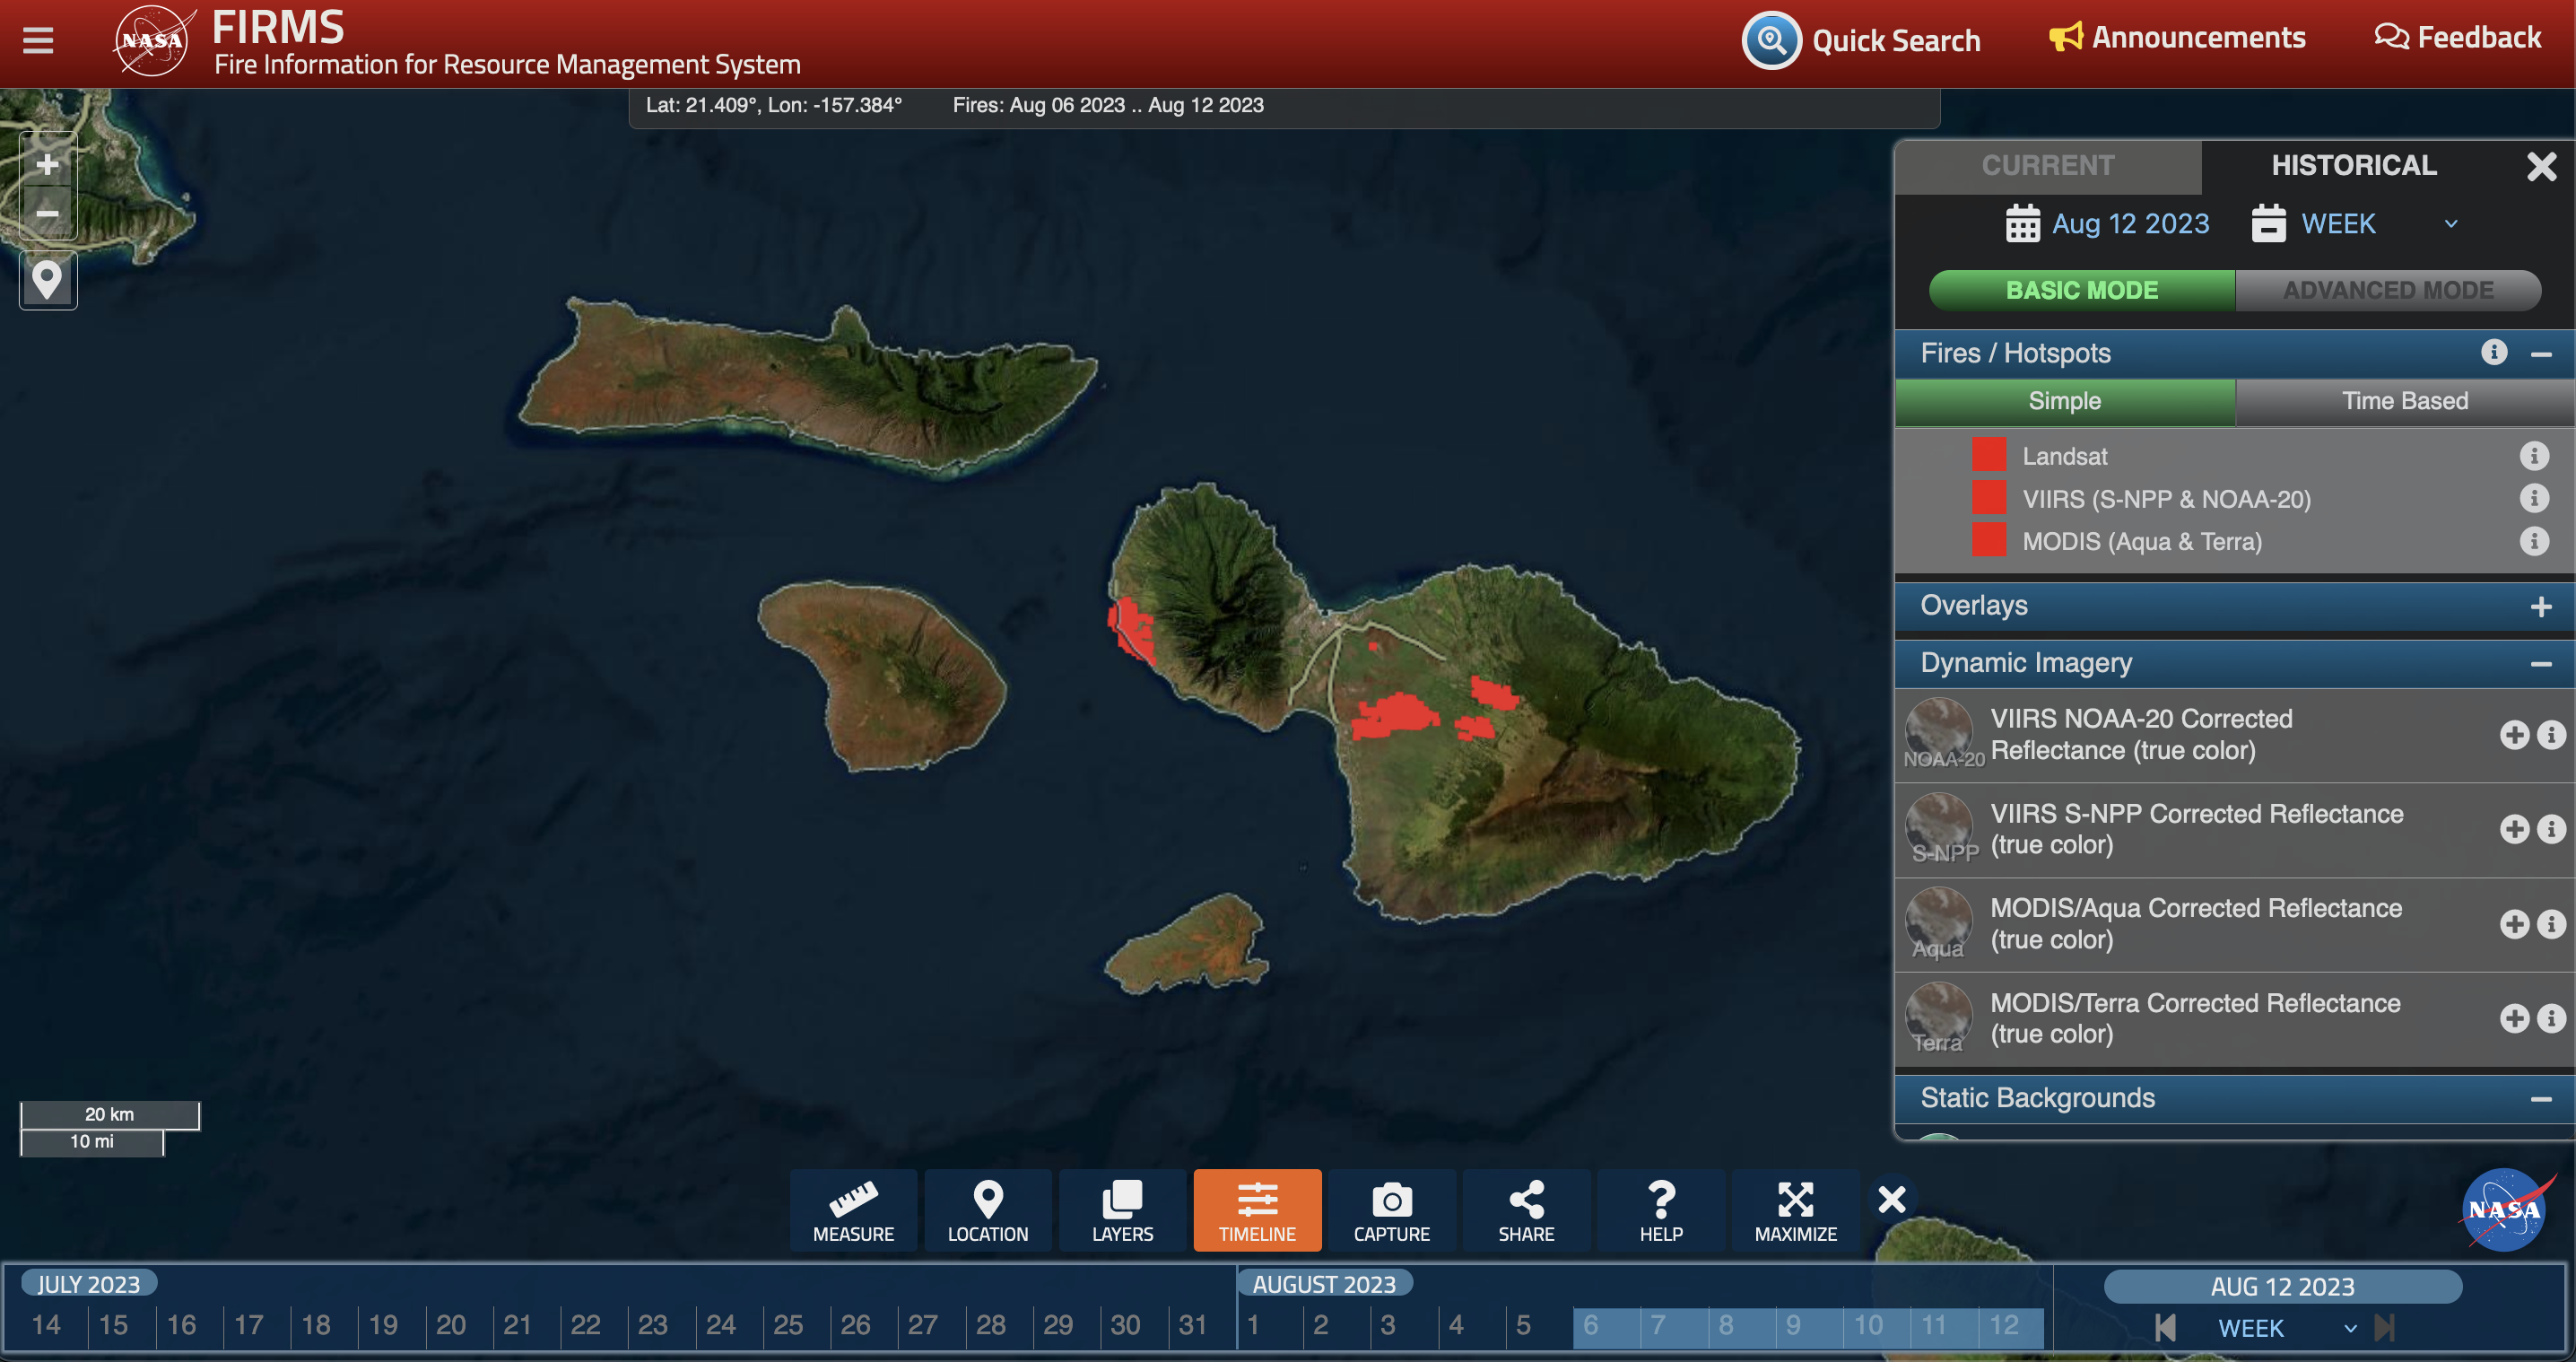
The NASA Fire Information for Resource Management System (FIRMS) combines data from multiple satellites to detect active wildfires, primarily by looking for the strong heat signature of fires. Their visualization dashboard shows locations where active fires were detected in the most recent satellite observations.
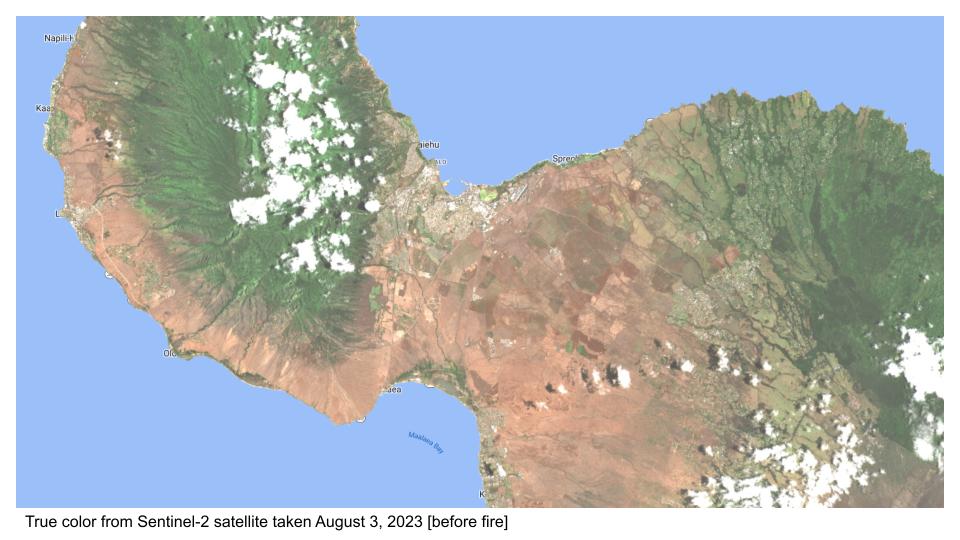
The Sentinel-2 satellite operated by the European Space Agency (ESA) takes images everywhere on Earth every 5 days using a multispectral camera (meaning it has visible color - red/green/blue - but also measures wavelengths like near-infrared and shortwave-infrared that we can't see with our eyes but are sensitive to properties of the surface like moisture content and molecular composition. The Sentinel-2 satellite images are freely available to the public (like most ESA and NASA satellite datasets).
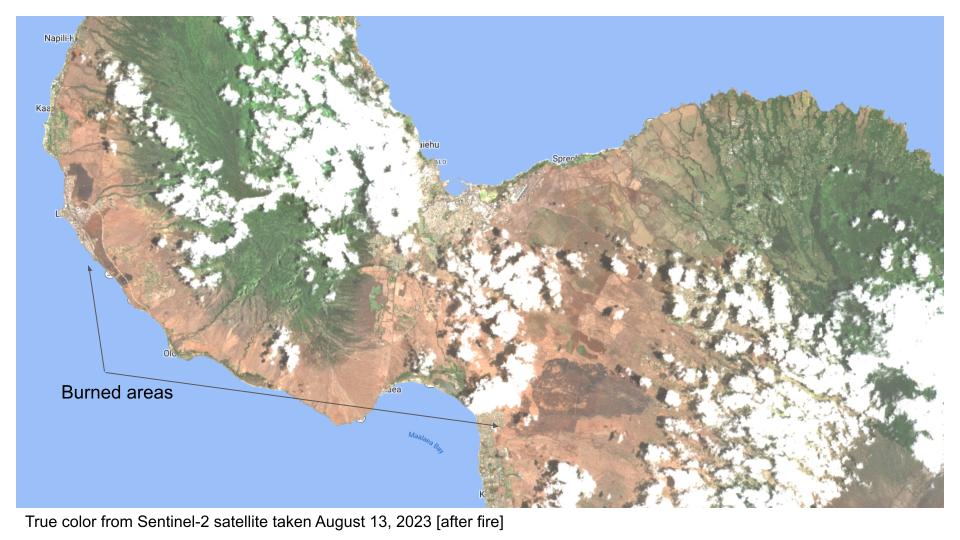
The images below show before and after in true color from Sentinel-2 taken before the fire on August 3 and after the fire on August 13. In the August 13 image, you can see the burned areas ("burn scars") in Lahaina and Upcountry/South Maui.
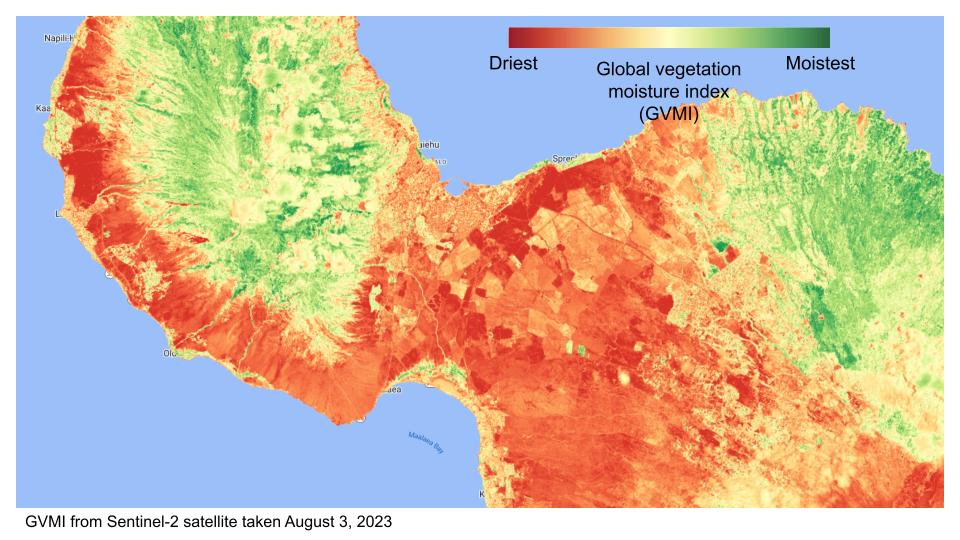
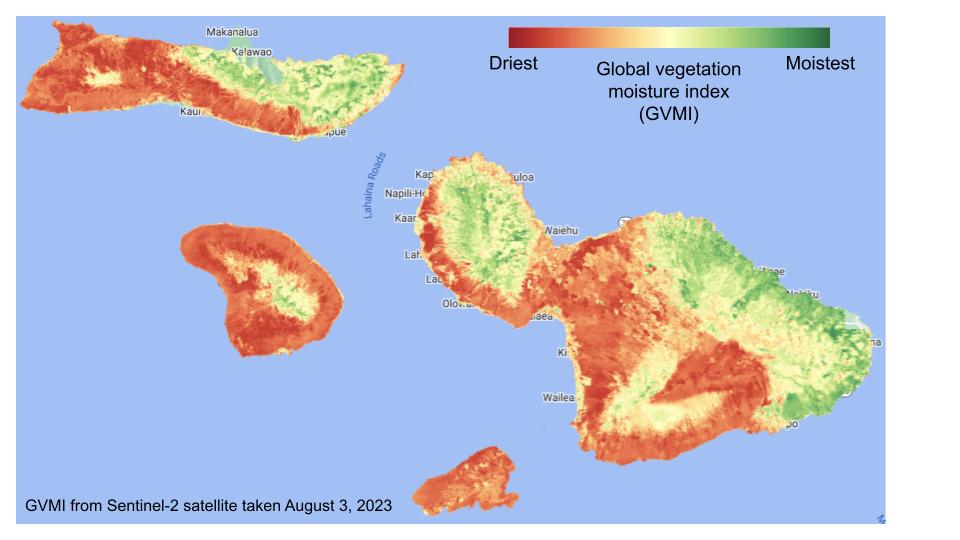
Fire risk mapping using satellite data is an active area of research. For example, this article describes how ESA used the Sentinel-2 satellite for fire risk mapping of Sardinia. In that article, they compute a "daily fire hazard index" from the satellite observations, which is a combination of several variables computed from the data including an index called Global Vegetation Moisture Index (GVMI), described in this paper. GVMI is just a normalized difference of the near-infrared and shortwave infrared channels of the multispectral satellite image. Values range from -1 to 1 and -1 indicates the driest surfaces and 1 indicates the moistest surfaces. (Note it's also sometimes called the Normalized Difference Moisture Index or NDMI, because not everything in the image is vegetation so the term GVMI can be confusing since not everything in the image is vegetation.)
The next image shows the same area as the true color images above, but in false color of GVMI. The colormap is stretched so the values range from -0.2 (driest) to 0.2 (moistest). Dark red = driest areas and dark green = moistest areas. The below image shows GVMI on August 3, 2023 (a few days before the fires). The large parallelograms overlaid in the second image show pixels from the MODIS satellite in which fires were detected (one of the datasets used in the FIRMS Dashboard, described later on this webpage).
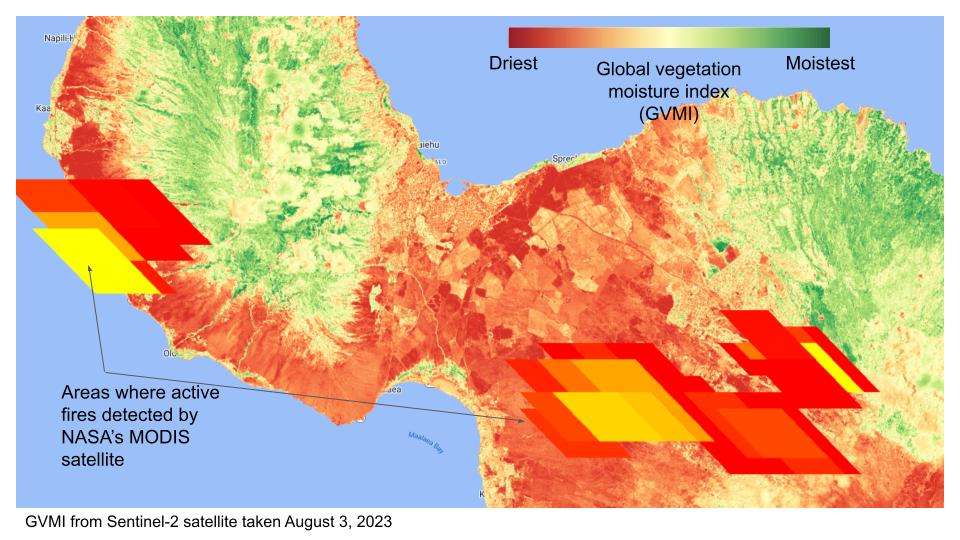
Note that this GVMI map can be visualized for any of the Sentinel-2 observations (every 5 days). In the future, this is one of the variables that can be monitored from satellite data to see which areas are driest and most at risk of wildfires (ideally combining it with other datasets too like in the article example in Sardinia).
The next image shows a GVMI map of all of Maui County on August 3. It can be seen that in addition to the extremely dry areas on Maui, there are extremely dry areas on western Molokai and on Lanai.
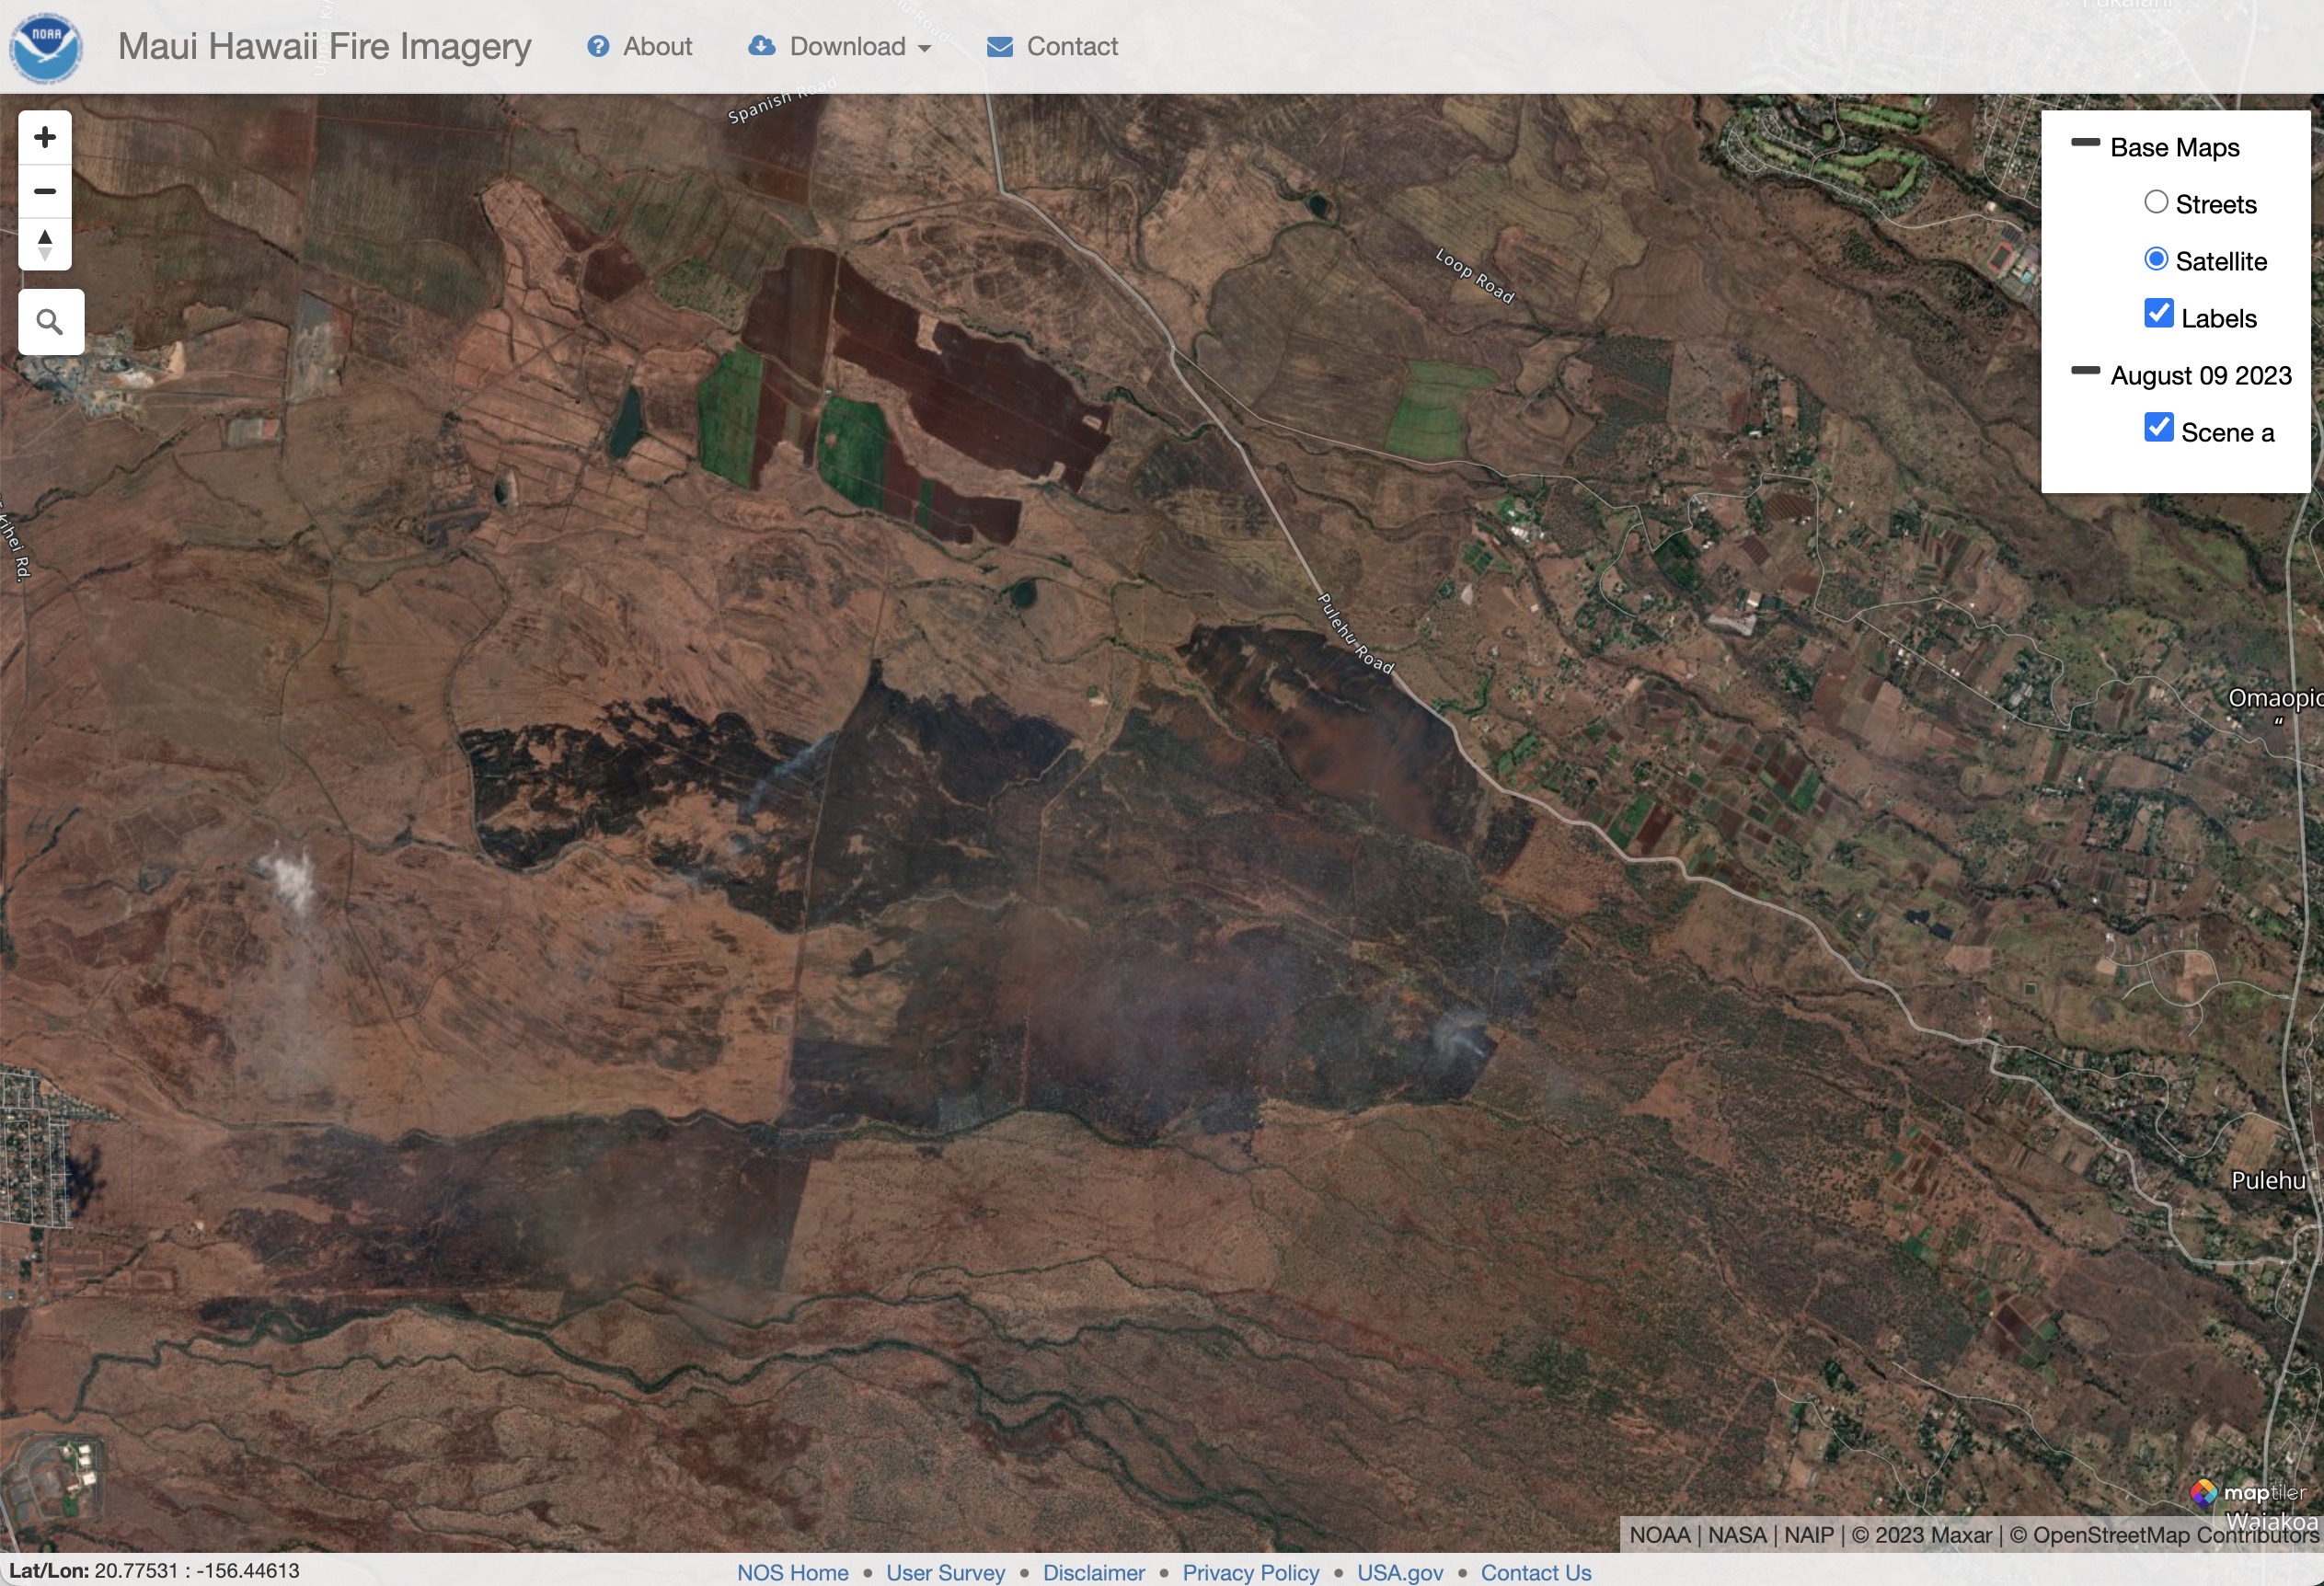
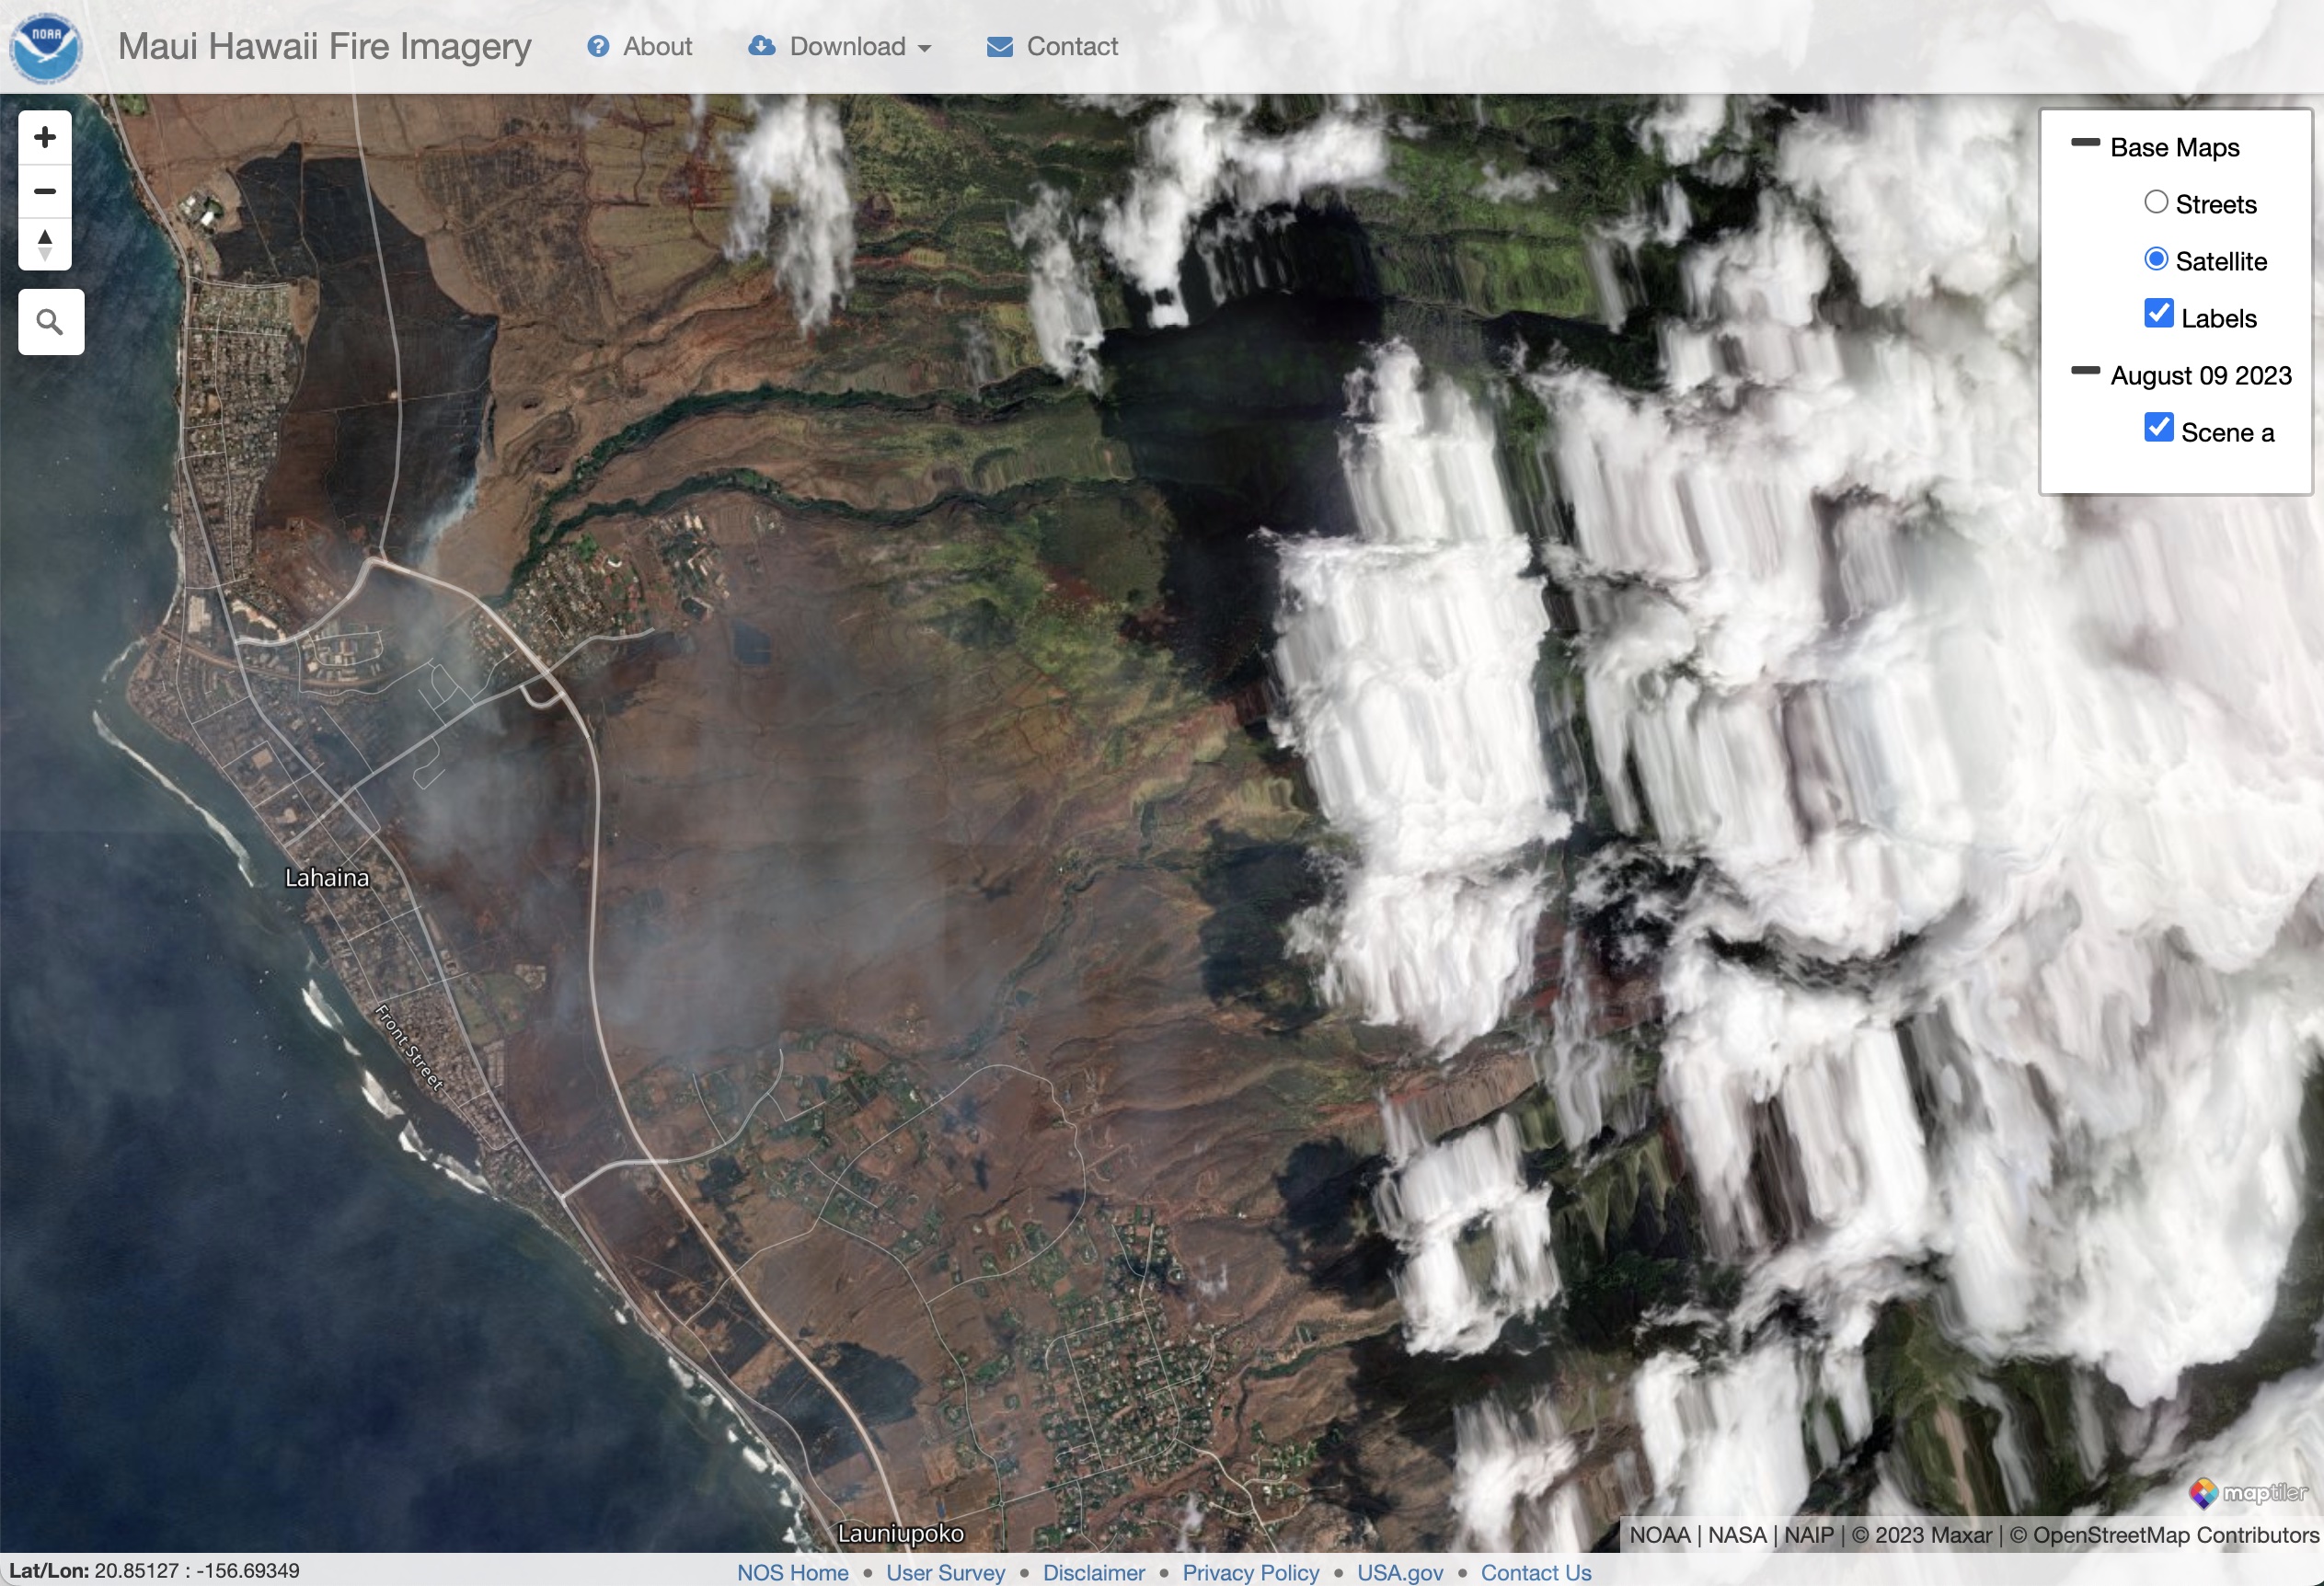
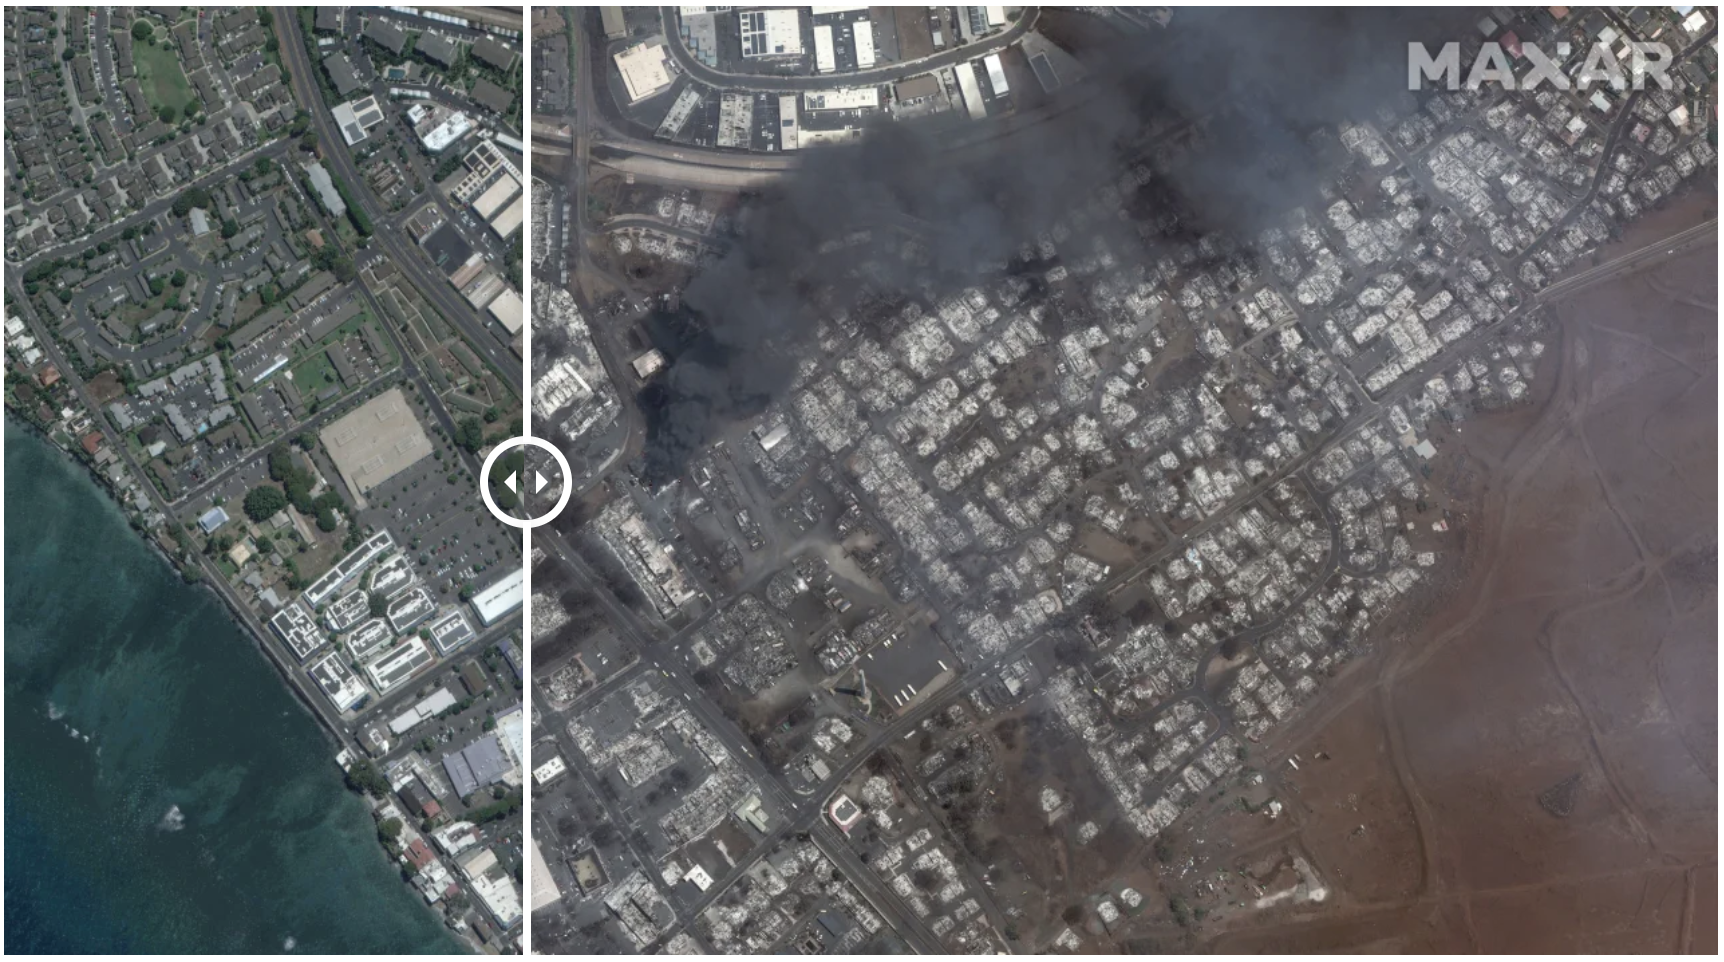
The NOAA Emergency Response Imagery Viewer shows before and after images with post-disaster high-resolution satellite images from Maxar. To add "Before" layer, click "+ Base Maps" in top right corner, then click Satellite. Click "+ August 09 2023" to expand a checkbox to toggle the after image on/off. See these instructions from NOAA for help with the viewer if you have trouble using it.
Satellites launched by space agencies are freely available (and can be explored below), but are at a lower resolution. Most satellite datasets collected by NASA and European Space Agency satellites are available publicly on the same day the satellite observations are taken. The high-resolution satellites from private companies like Planet, Maxar, and others are typically not freely available. However, many companies have disaster response programs that give free access to high-resolution imagery following disasters.
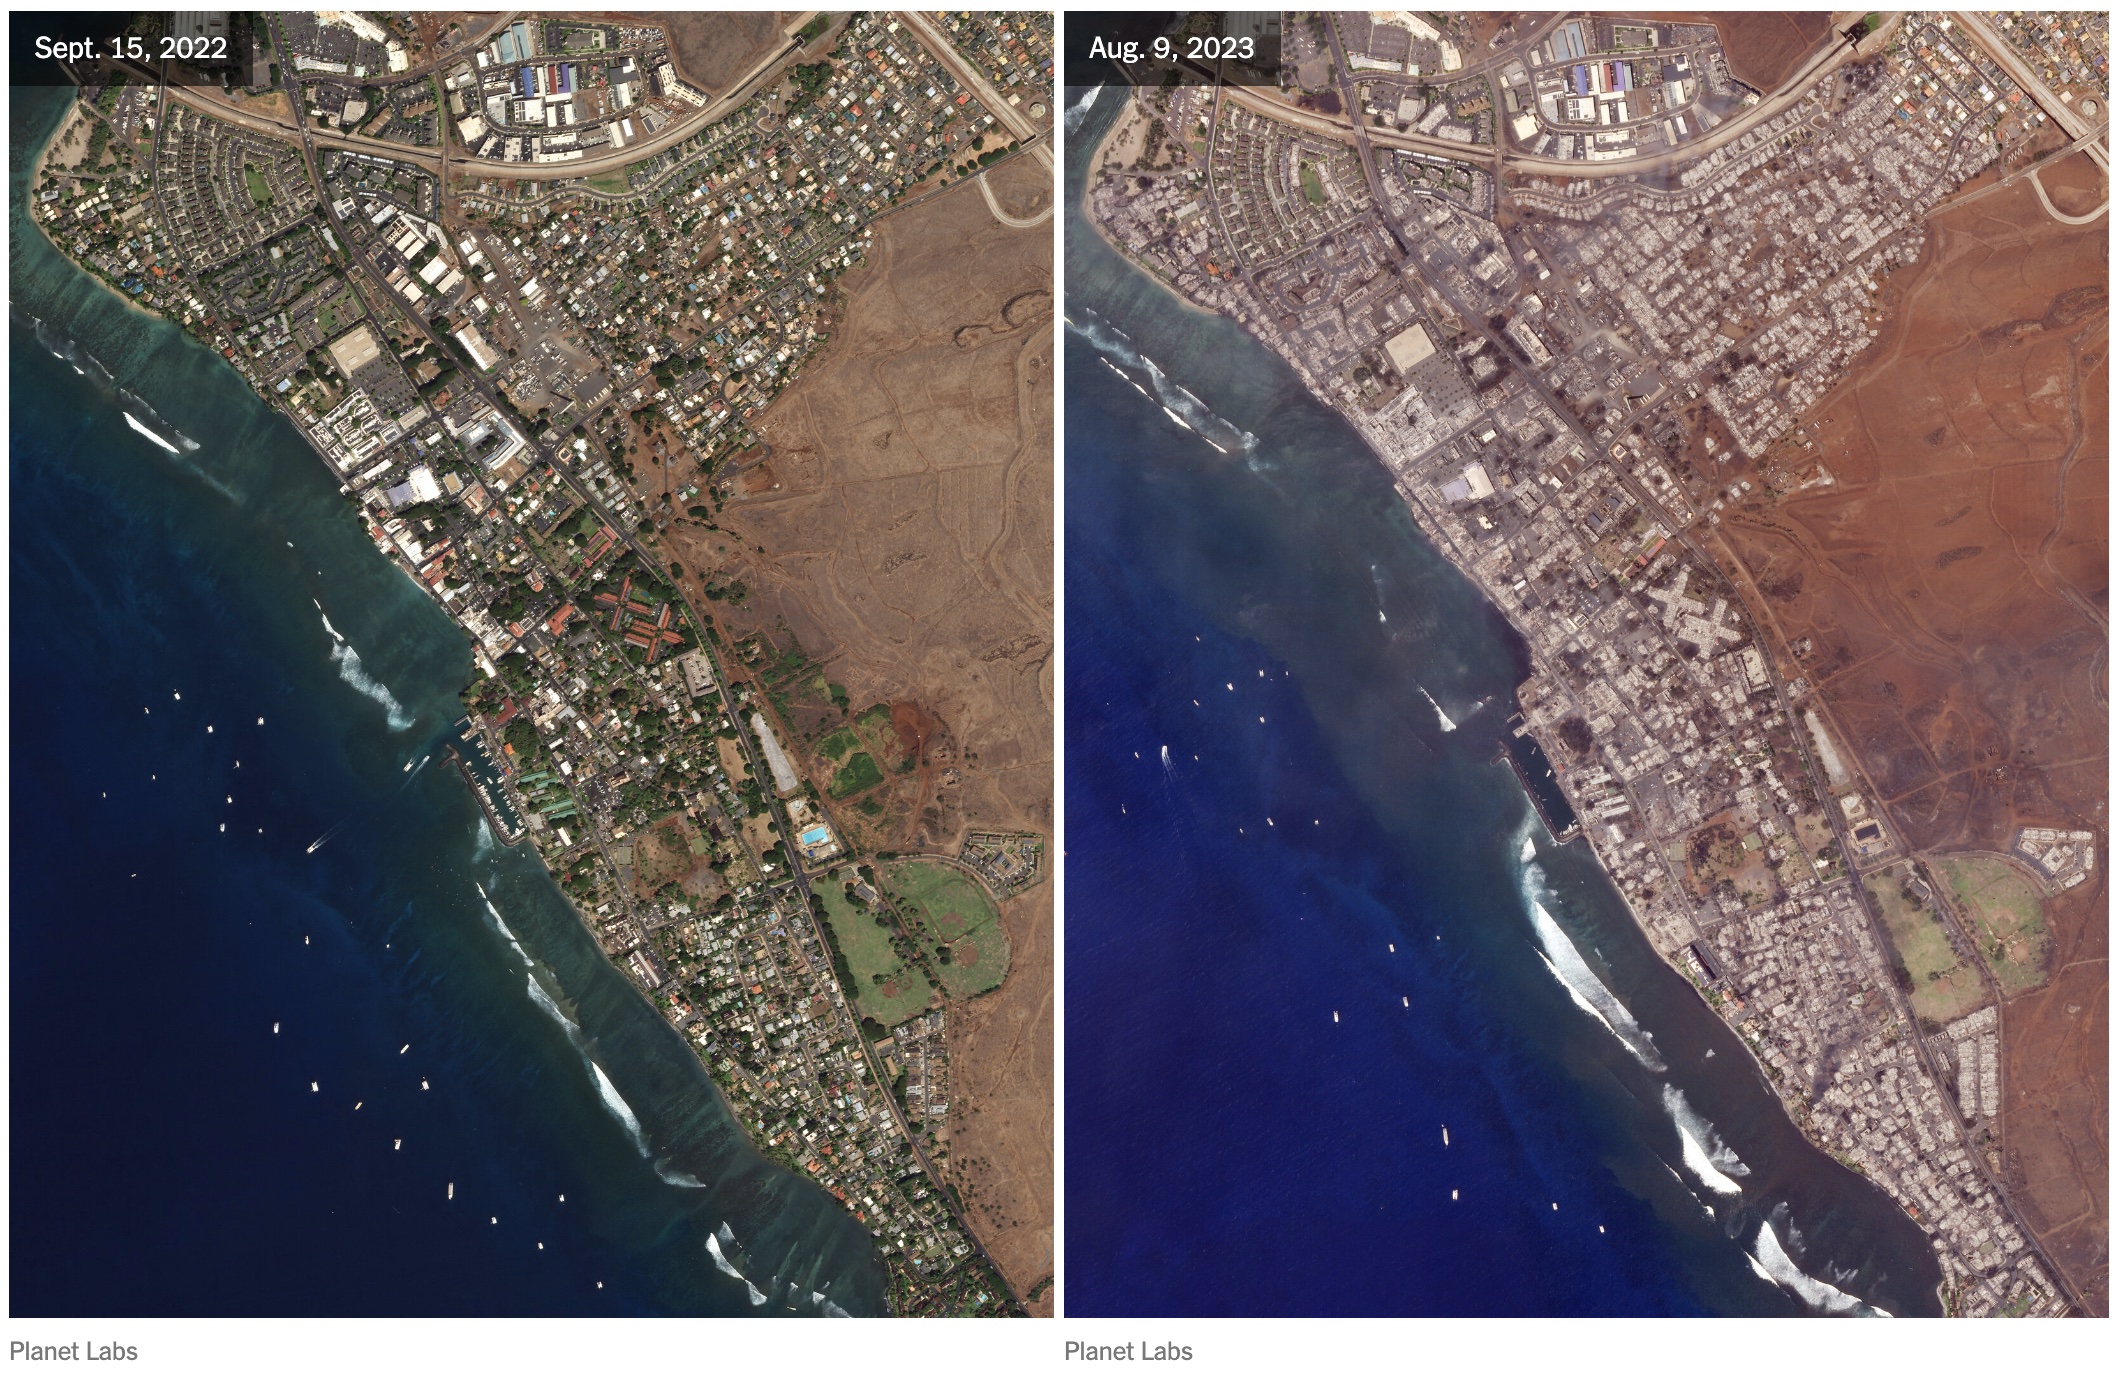
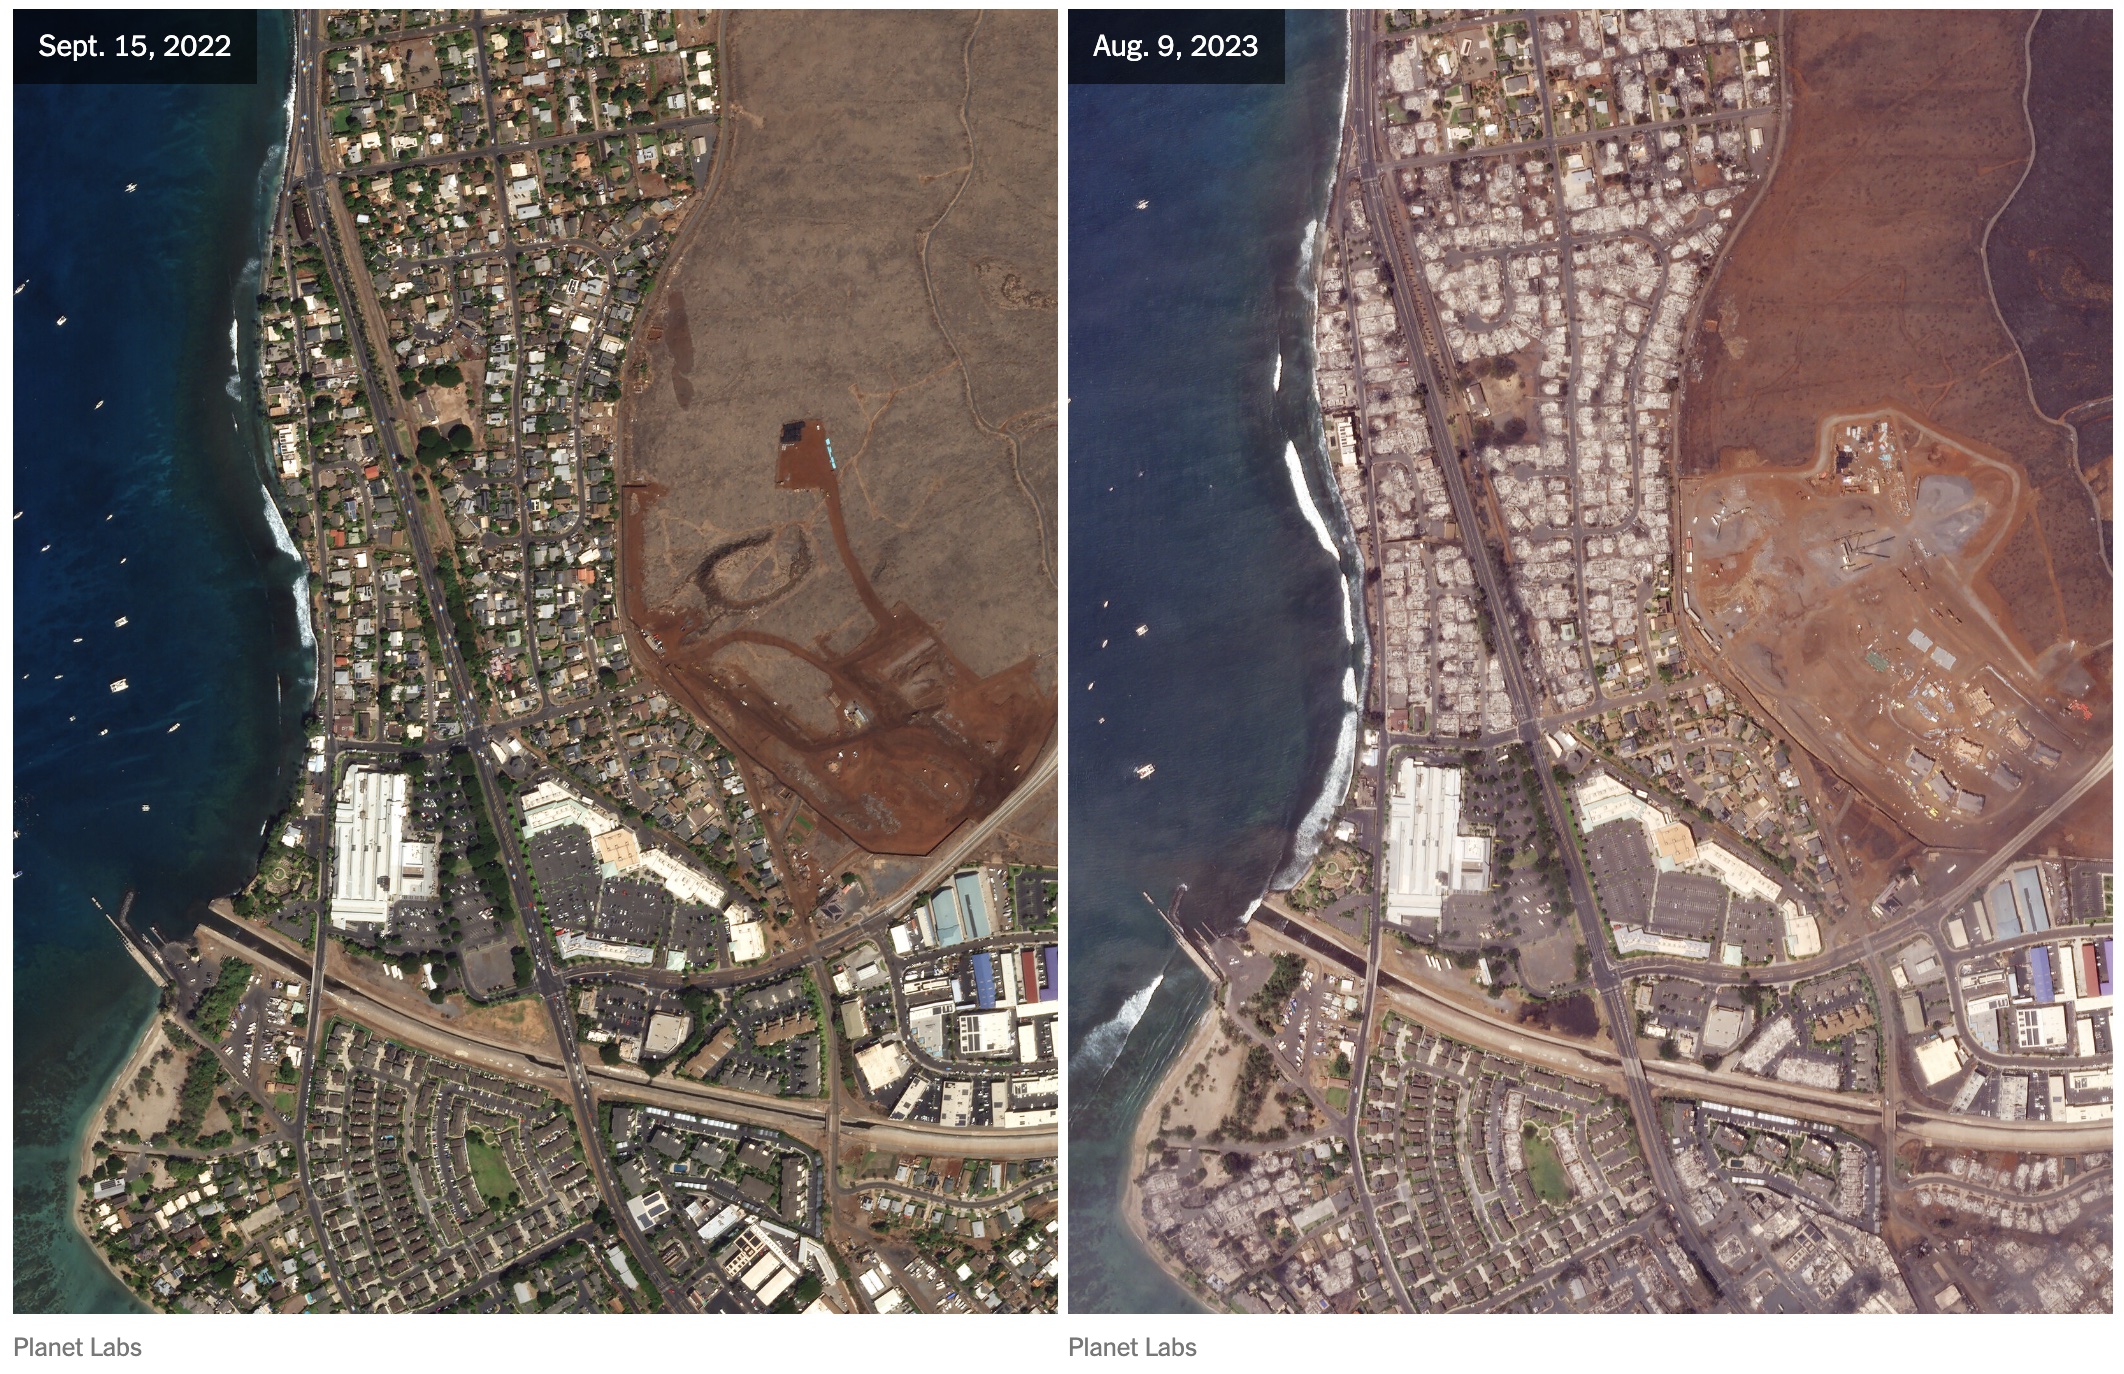
Planet makes their high-resolution imagery available to the public following select disaster events, including the Maui wildfires.
Maxar has made high-resolution post-disaster images from August 9, 2023 openly available for download.
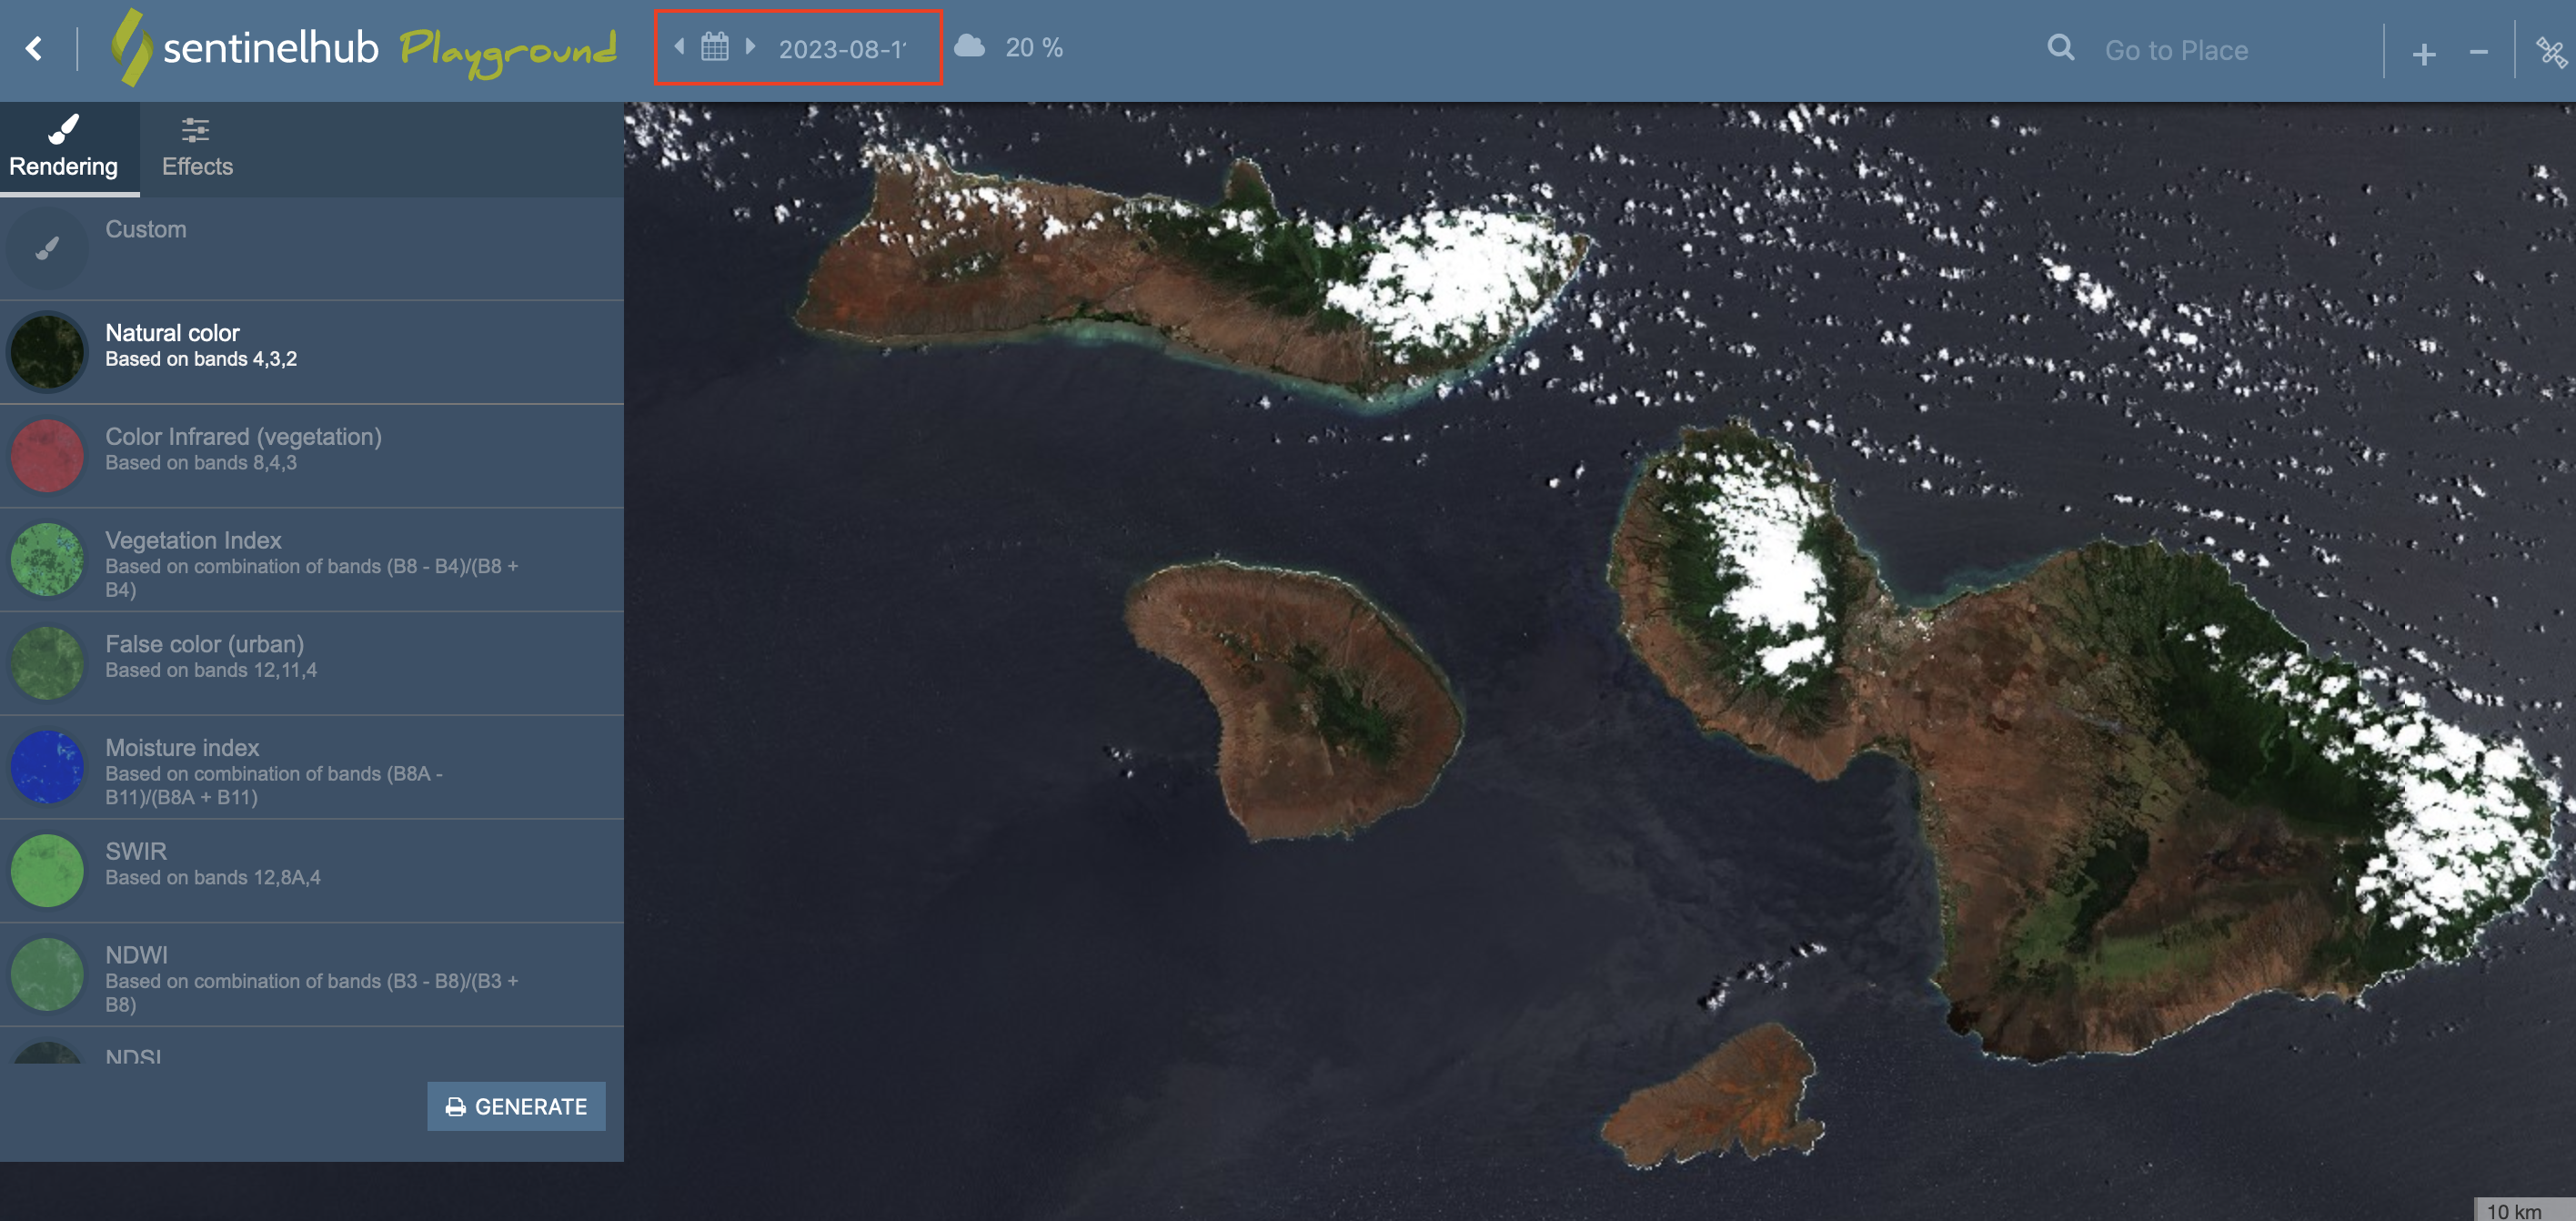
The SentinelHub Playground makes data from the Sentinel-2 satellites available to explore in your web browser. The date of the imagery can be controlled in the calendar icon on the webpage header (highlighted by a red box in the image above). Sentinel-2 images are captured at least every 5 days, at approximately 10:00am local time. The last Sentinel-2 images over Maui were taken on August 8, so the next image should be availalbe on August 13.
This website provides the raw geospatial data of active fire detections from the NASA MODIS, VIIRS, and Landsat satellites to generate the map on the NASA Fire Information for Resource Management System linked above. You can access the data by downloading the files or using their API.