📧 Contact: If you have questions or think we can help with your data needs, contact Ana M. Tárano at atarano@asu.edu or Hannah Kerner at hkerner@asu.edu.
🚧 What’s next: This summer, we’re working on improving the flood extent map in upper Kula and Iao Valley, based on requests.
As always, we welcome suggestions and feedback from the community on what is most helpful.
🗓️ Last updated: This page was last updated on June 12, 2026 11:39AM (HNL).
Satellite and other geospatial data also allow us to better understand the evolution and impact of the Kona Low in March 2026 on Maui County and Hawaii. There is an abundance of information online about the storm including satellite data, but it can be hard to sort through everything. On this page, we organize the sources of satellite data related to the Kona Low storms and share resources for accessing this satellite data and derived products.
|
“The Hawaiʻi Department of Agriculture and Biosecurity (DAB) announces the establishment of the Emergency Farmer Relief Program for farmers and ranchers statewide who were impacted by the recent storm systems – Kona Low 1 and Kona Low 2. Farms, ranches and businesses may apply to receive a one-time grant of $1,500.00 to address immediate needs resulting from the storm. A total of $500,000 has been authorized for this emergency grant program from DAB restricted funds.
... Applications for the Emergency Farmer Relief Program will open on Tuesday, March 24, 2026. Applicants who complete and submit applications by Friday, March 27, 2026 will be prioritized for funding. Awards will be announced in the week of March 30, 2026. The program application may be found on DAB’s website at https://dab.hawaii.gov/emergencyfarmerrelief/. ⚠️ Applicants must have experienced damage or losses from the storms and must provide a General Excise Tax (GET) license, proving they conduct business in the state. Questions on the program or application should be directed to ✉️ dab.efr@hawaii.gov. You can also view the Emergency Farmer Relief Program FAQs. — Hawaiʻi Department of Agriculture and Biosecurity post on March 23, 2026 |
ℹ️ This website has 1) information about what to do now vs in a few weeks, 2) opportunity to report damage losses, and 3) resources for farmers and ranchers impacted by the storms. The data collected from the damage report will be used to advocate for more resources for farmers and ranchers in Hawaii.
📋 Immediate Response (Days & Weeks):
⚠️ What life stage were your crops in (e.g., planting, flowering, harvest) when they were damaged or destroyed due to the storms?
⚠️ Monitor pests and disease.
☐ Document damage (photos, videos, and notes) of affected areas (homes, farm buildings, fences, irrigation, sheds, roads, waterways, etc.).
☐ Keep receipts for storm-related expenses (repairs, feed, labor, emergency purchases). ☐ Track lost sales, buyers, income, and cleanup labor hours. ☐ Check in with yourself and workers. Seek support when needed. — Agriculture Stewardship Hawaii and Synergistic Hawaii Agriculture Council. |
According to HFU's newsletter from March 24th, 2026, your input will:
|
ℹ️ The Hawaiʻi Agriculture Disaster Response Resource Guide compiles critical information to help farmers and ranchers respond to and recover from recent storms. It includes emergency contacts, step-by-step guidance on documenting damage, and links to report impacts for potential assistance. The guide also connects producers to county- and island-specific support, food and housing resources, livestock care, and state and federal recovery programs (including USDA assistance). Overall, it serves as a centralized hub to help agricultural producers navigate immediate response, access aid, and plan for recovery.
| 📝 Report Damage to MEMA |
Mālama Kula is helping with storm recovery efforts across Kula. Now that the immediate storm threats have passed, they are responding to downed trees, blocked access, and debris throughout the community, as shared in their March 17th, 2026 newsletter.
If you have fallen trees, blocked driveways, or need help clearing storm debris, Mālama Kula may be able to help with:
If you or someone you know needs support, please reach out to ✉️malamakula@gmail.com:
|
♻️ Free Green Waste Bins Available
Mālama Kula also has free green waste bins available for storm cleanup if you are clearing branches or other green debris.
📍 Current Locations:
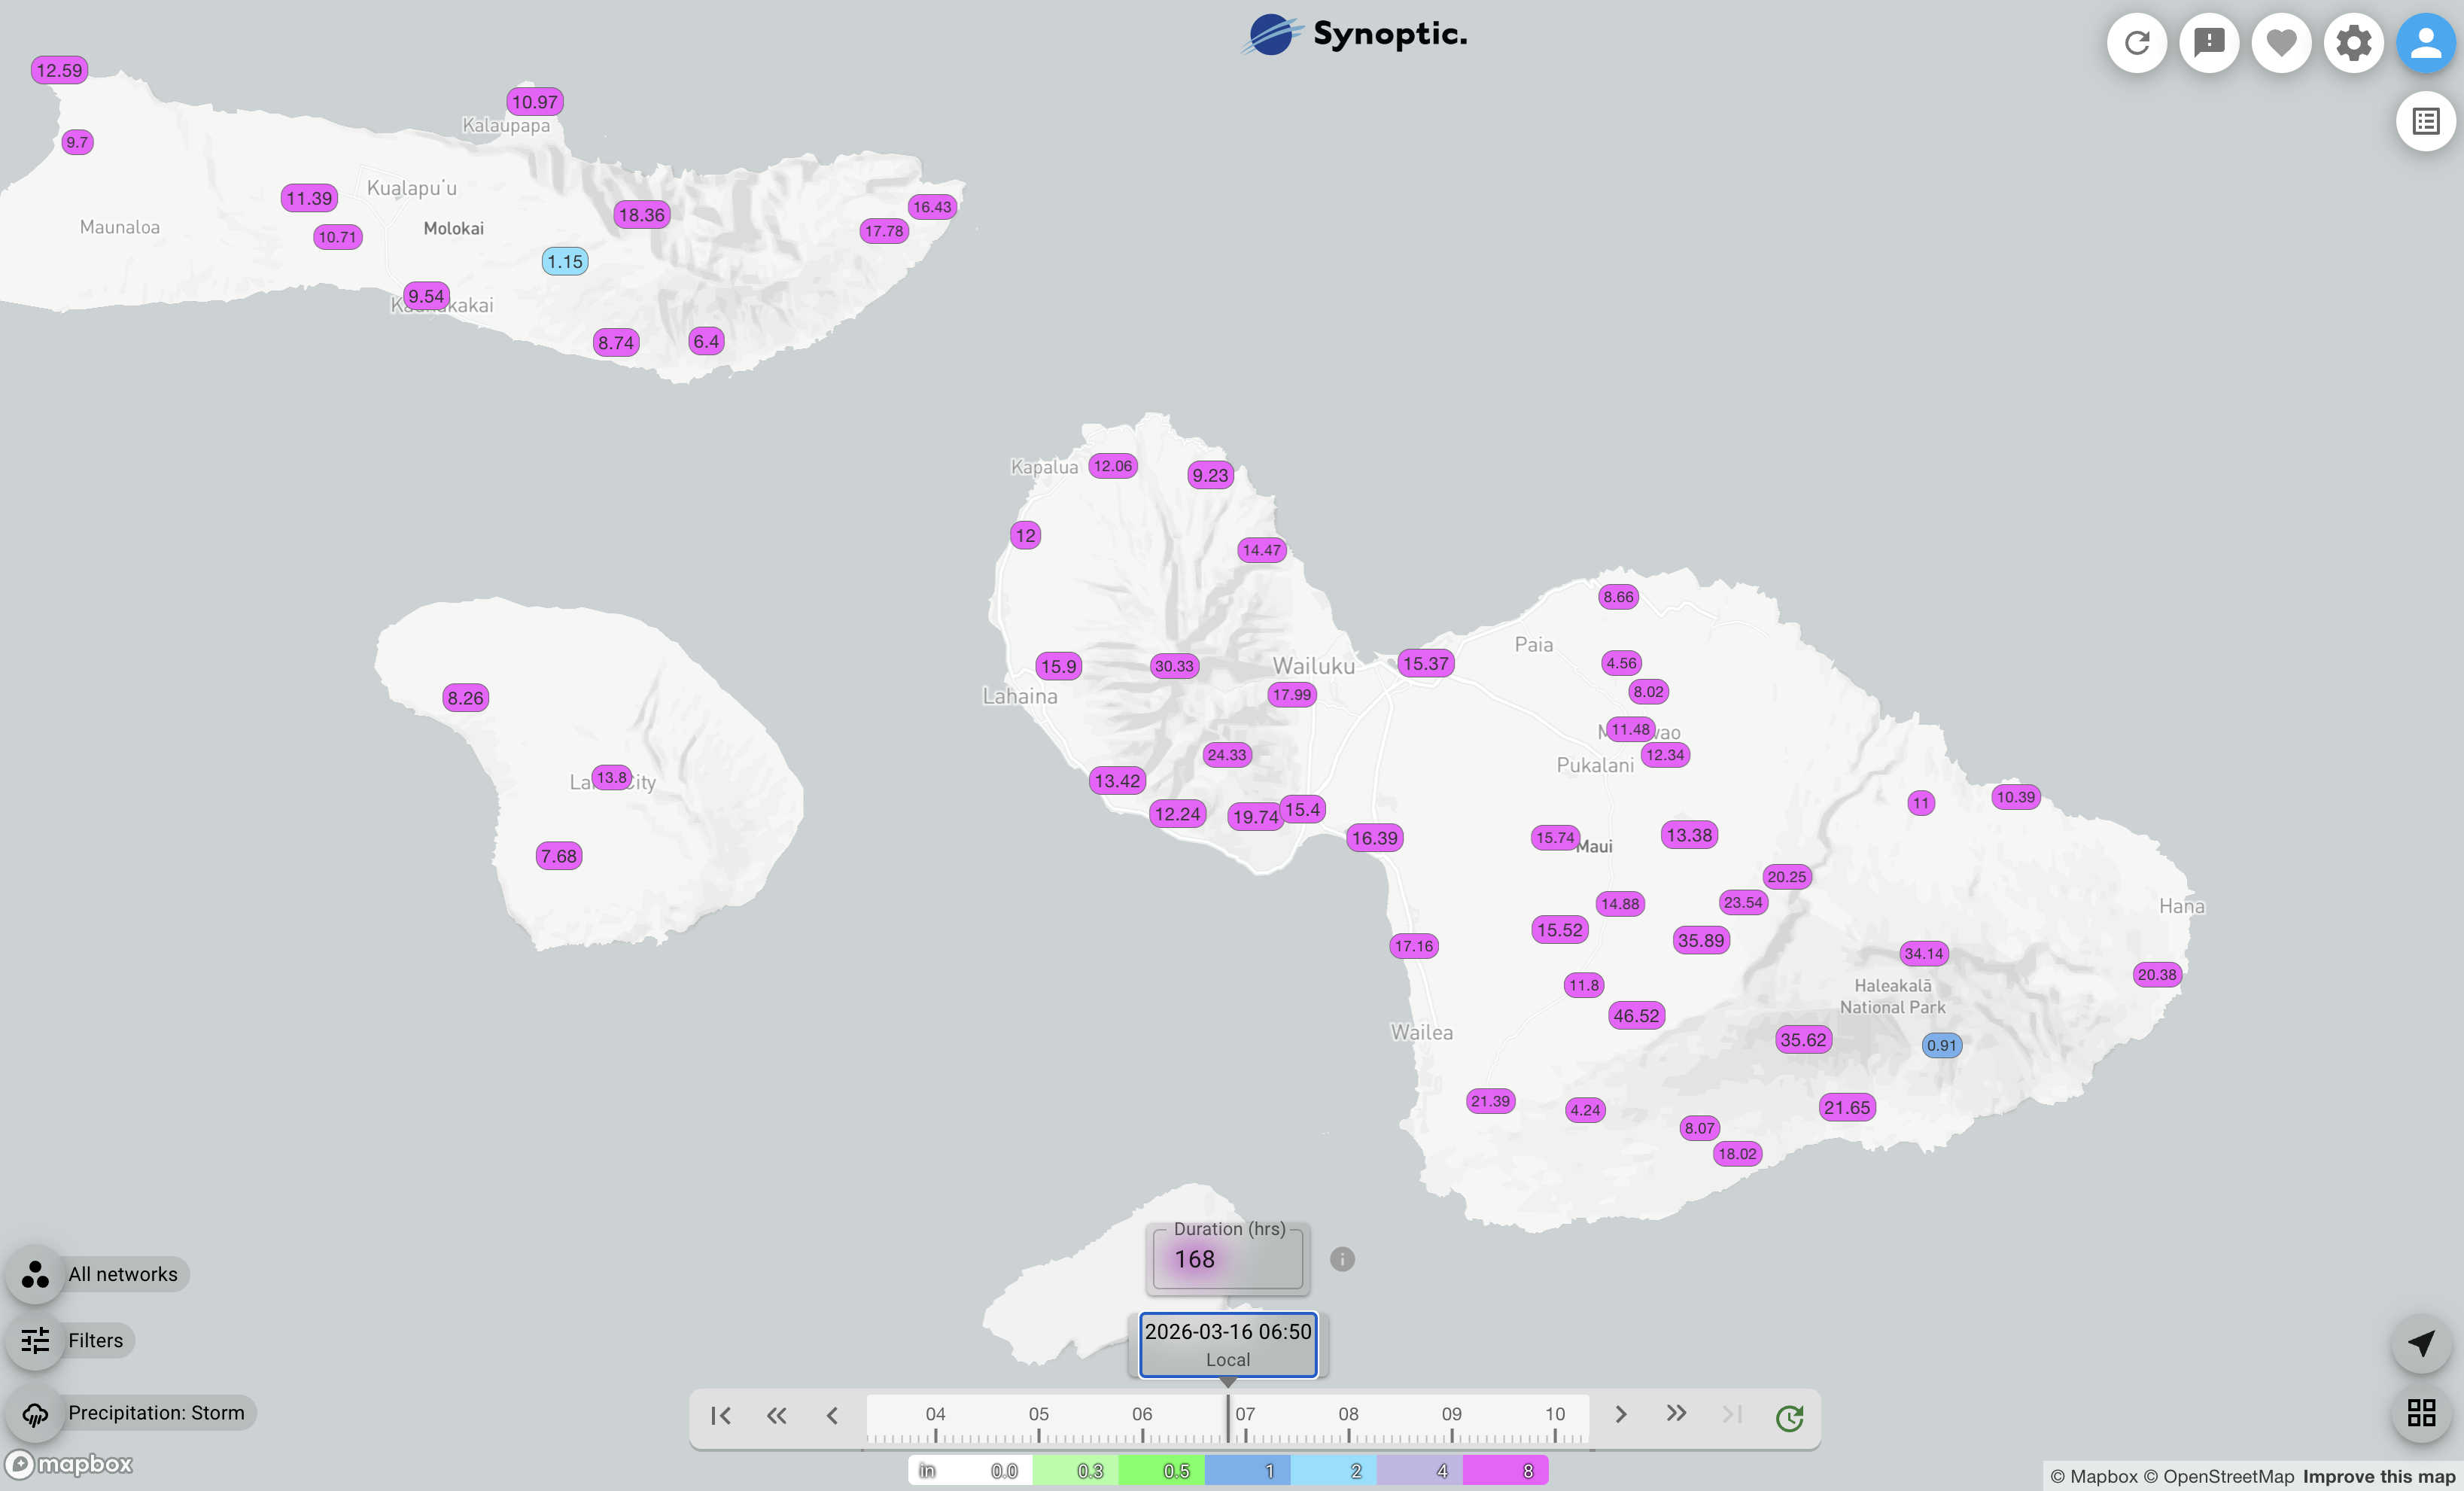
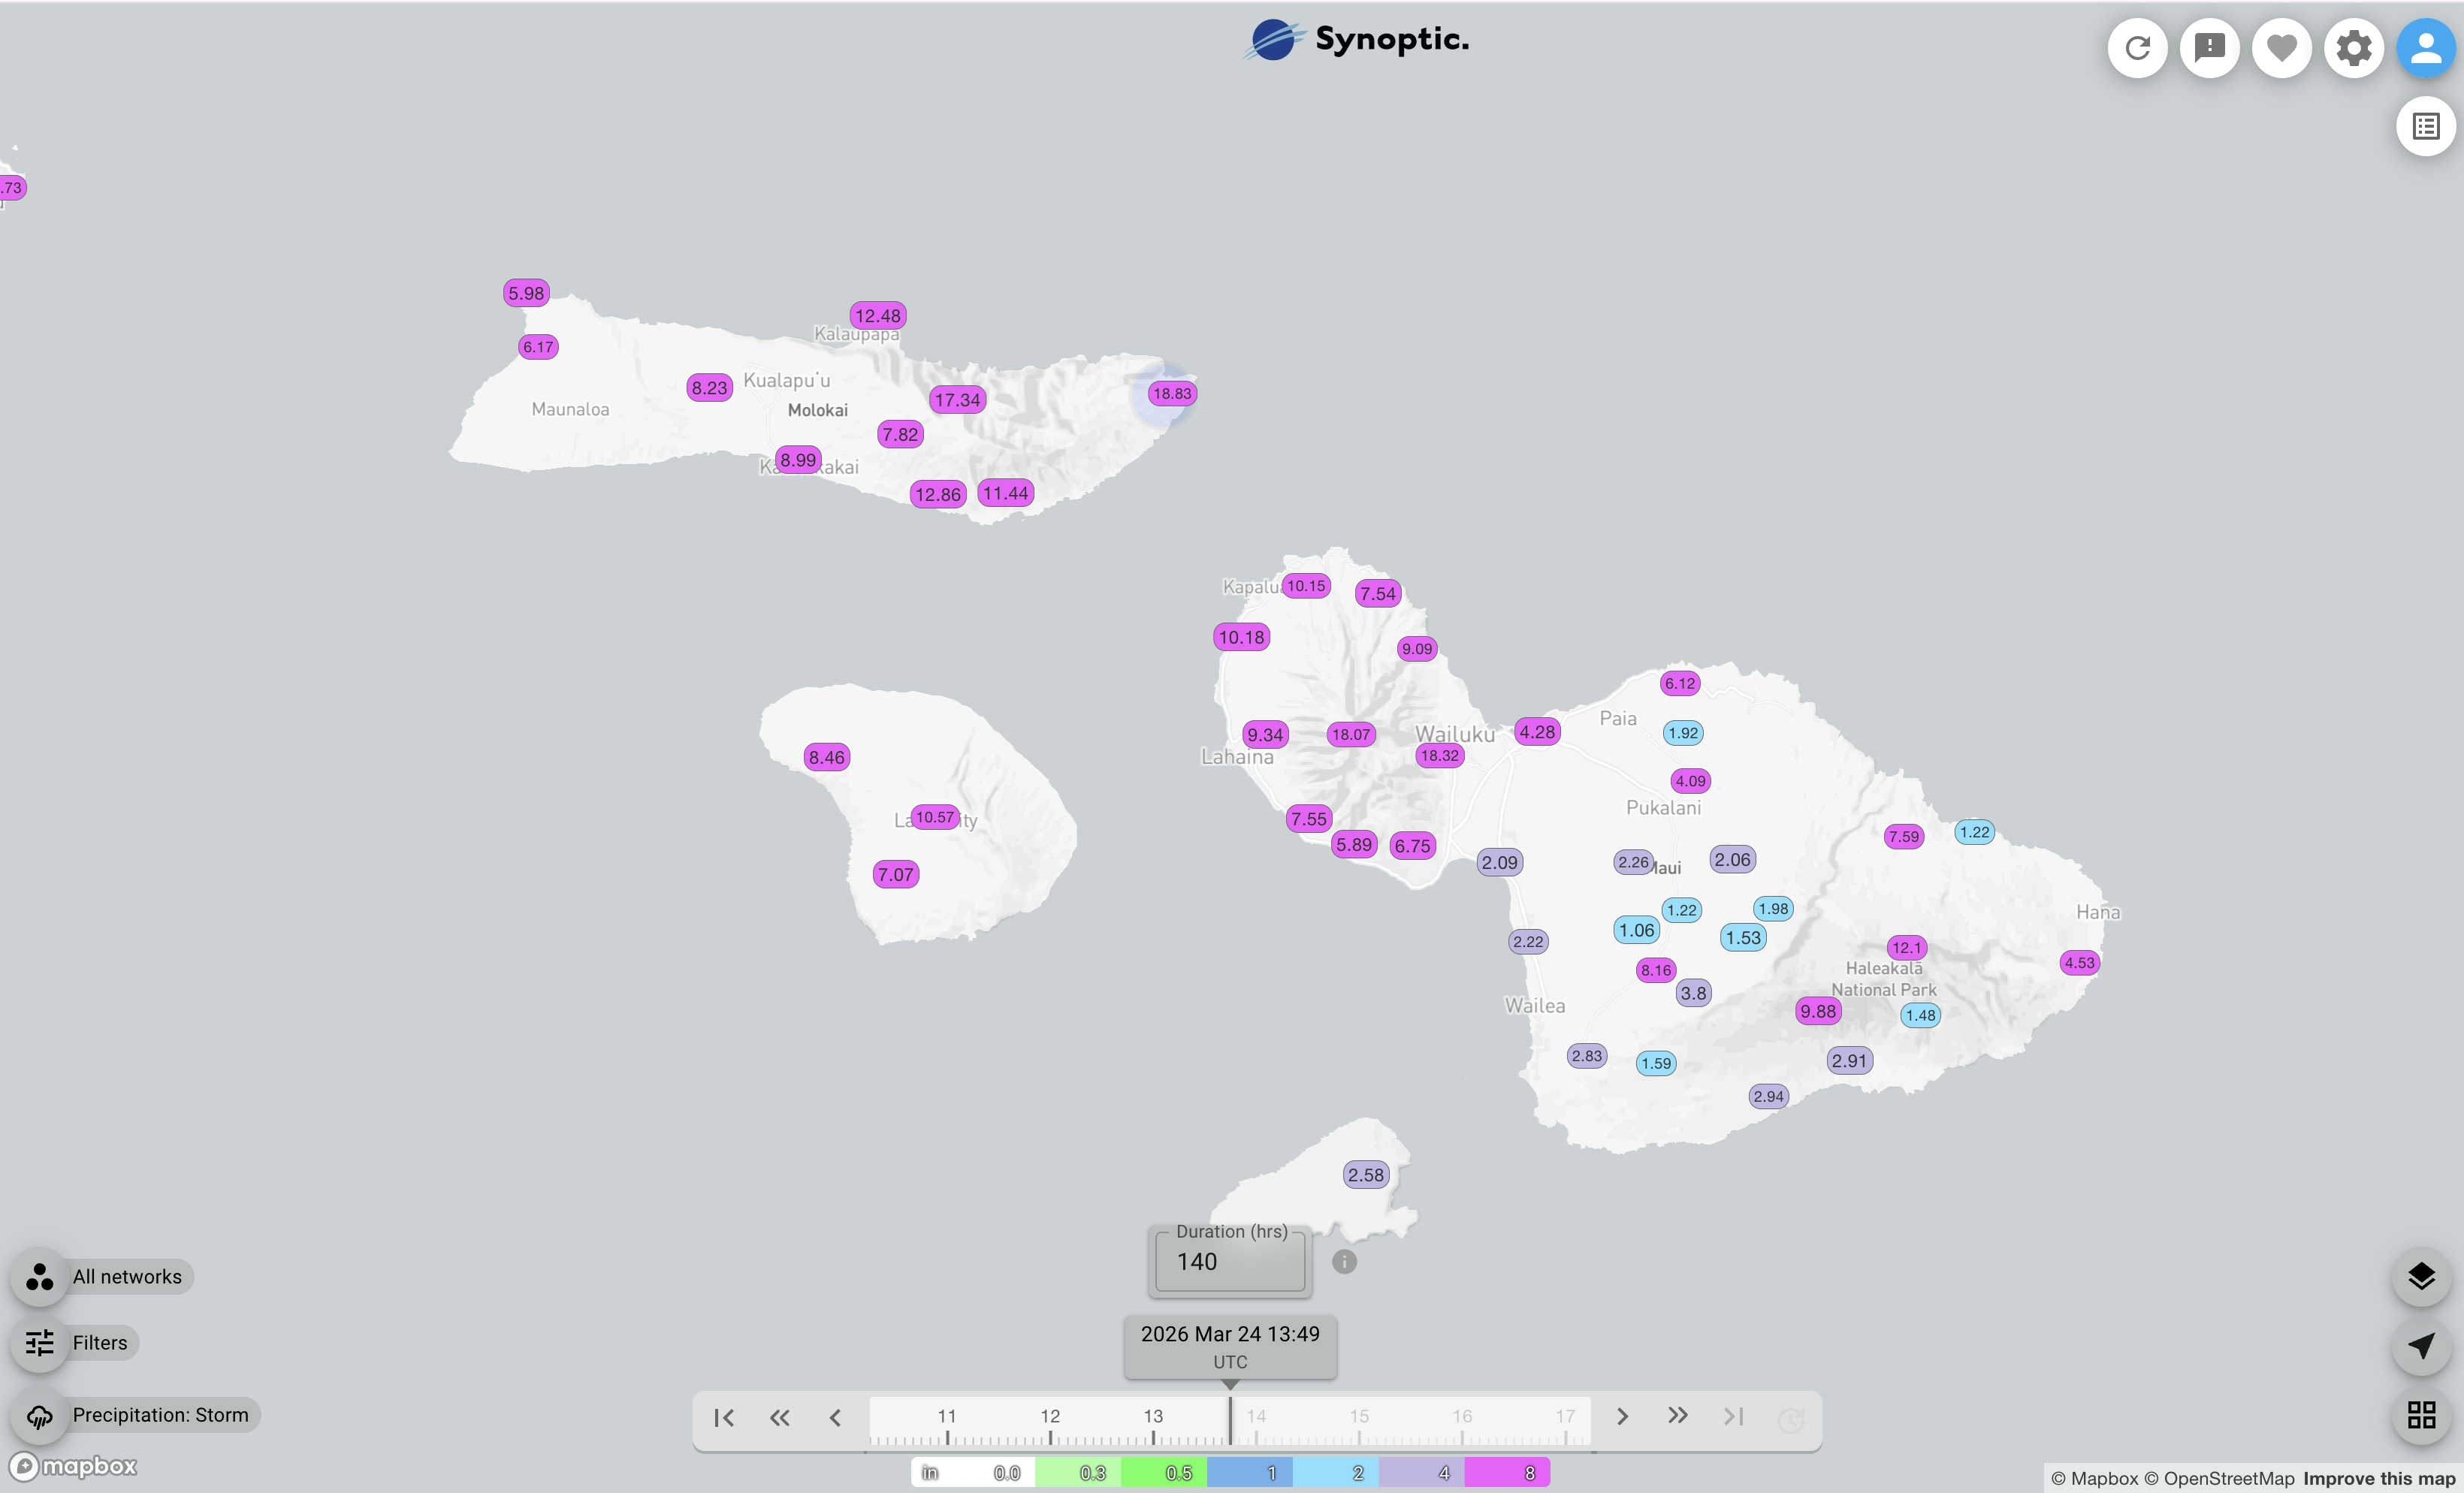
ℹ️ This interactive map shows total rainfal in inches in Maui Nui (and Hawaii if you zoom out) from March 10th, 2026 through March 16th.
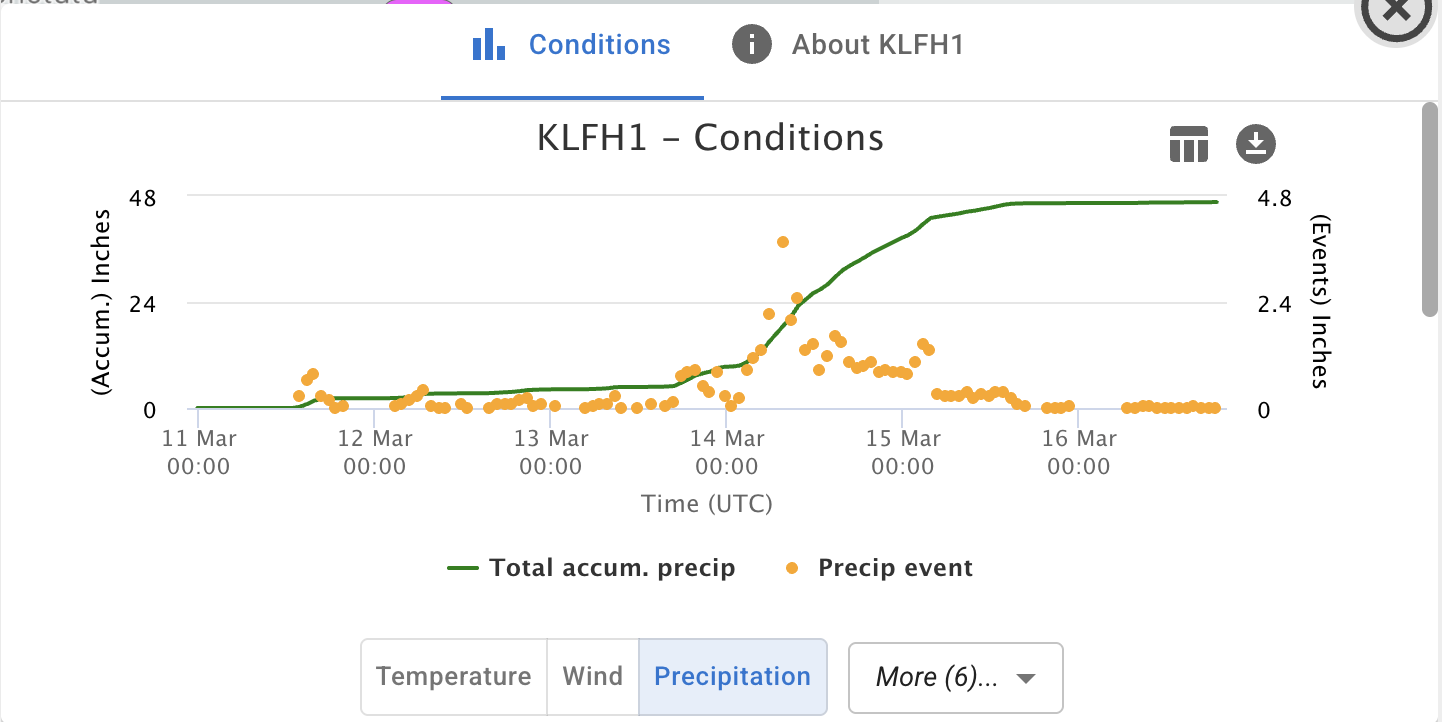
🔍 To see individual stations, zoom in, click on the station ↖️. Then, select "Display Conditions," and the "Precipitation" button for graphs of the total rainfall over time. Here's an example graph:
🛜 In case of low connectivity, we have linked a screenshot of the total rainfall in Maui Nui from March 10th, 2026 through March 16th.
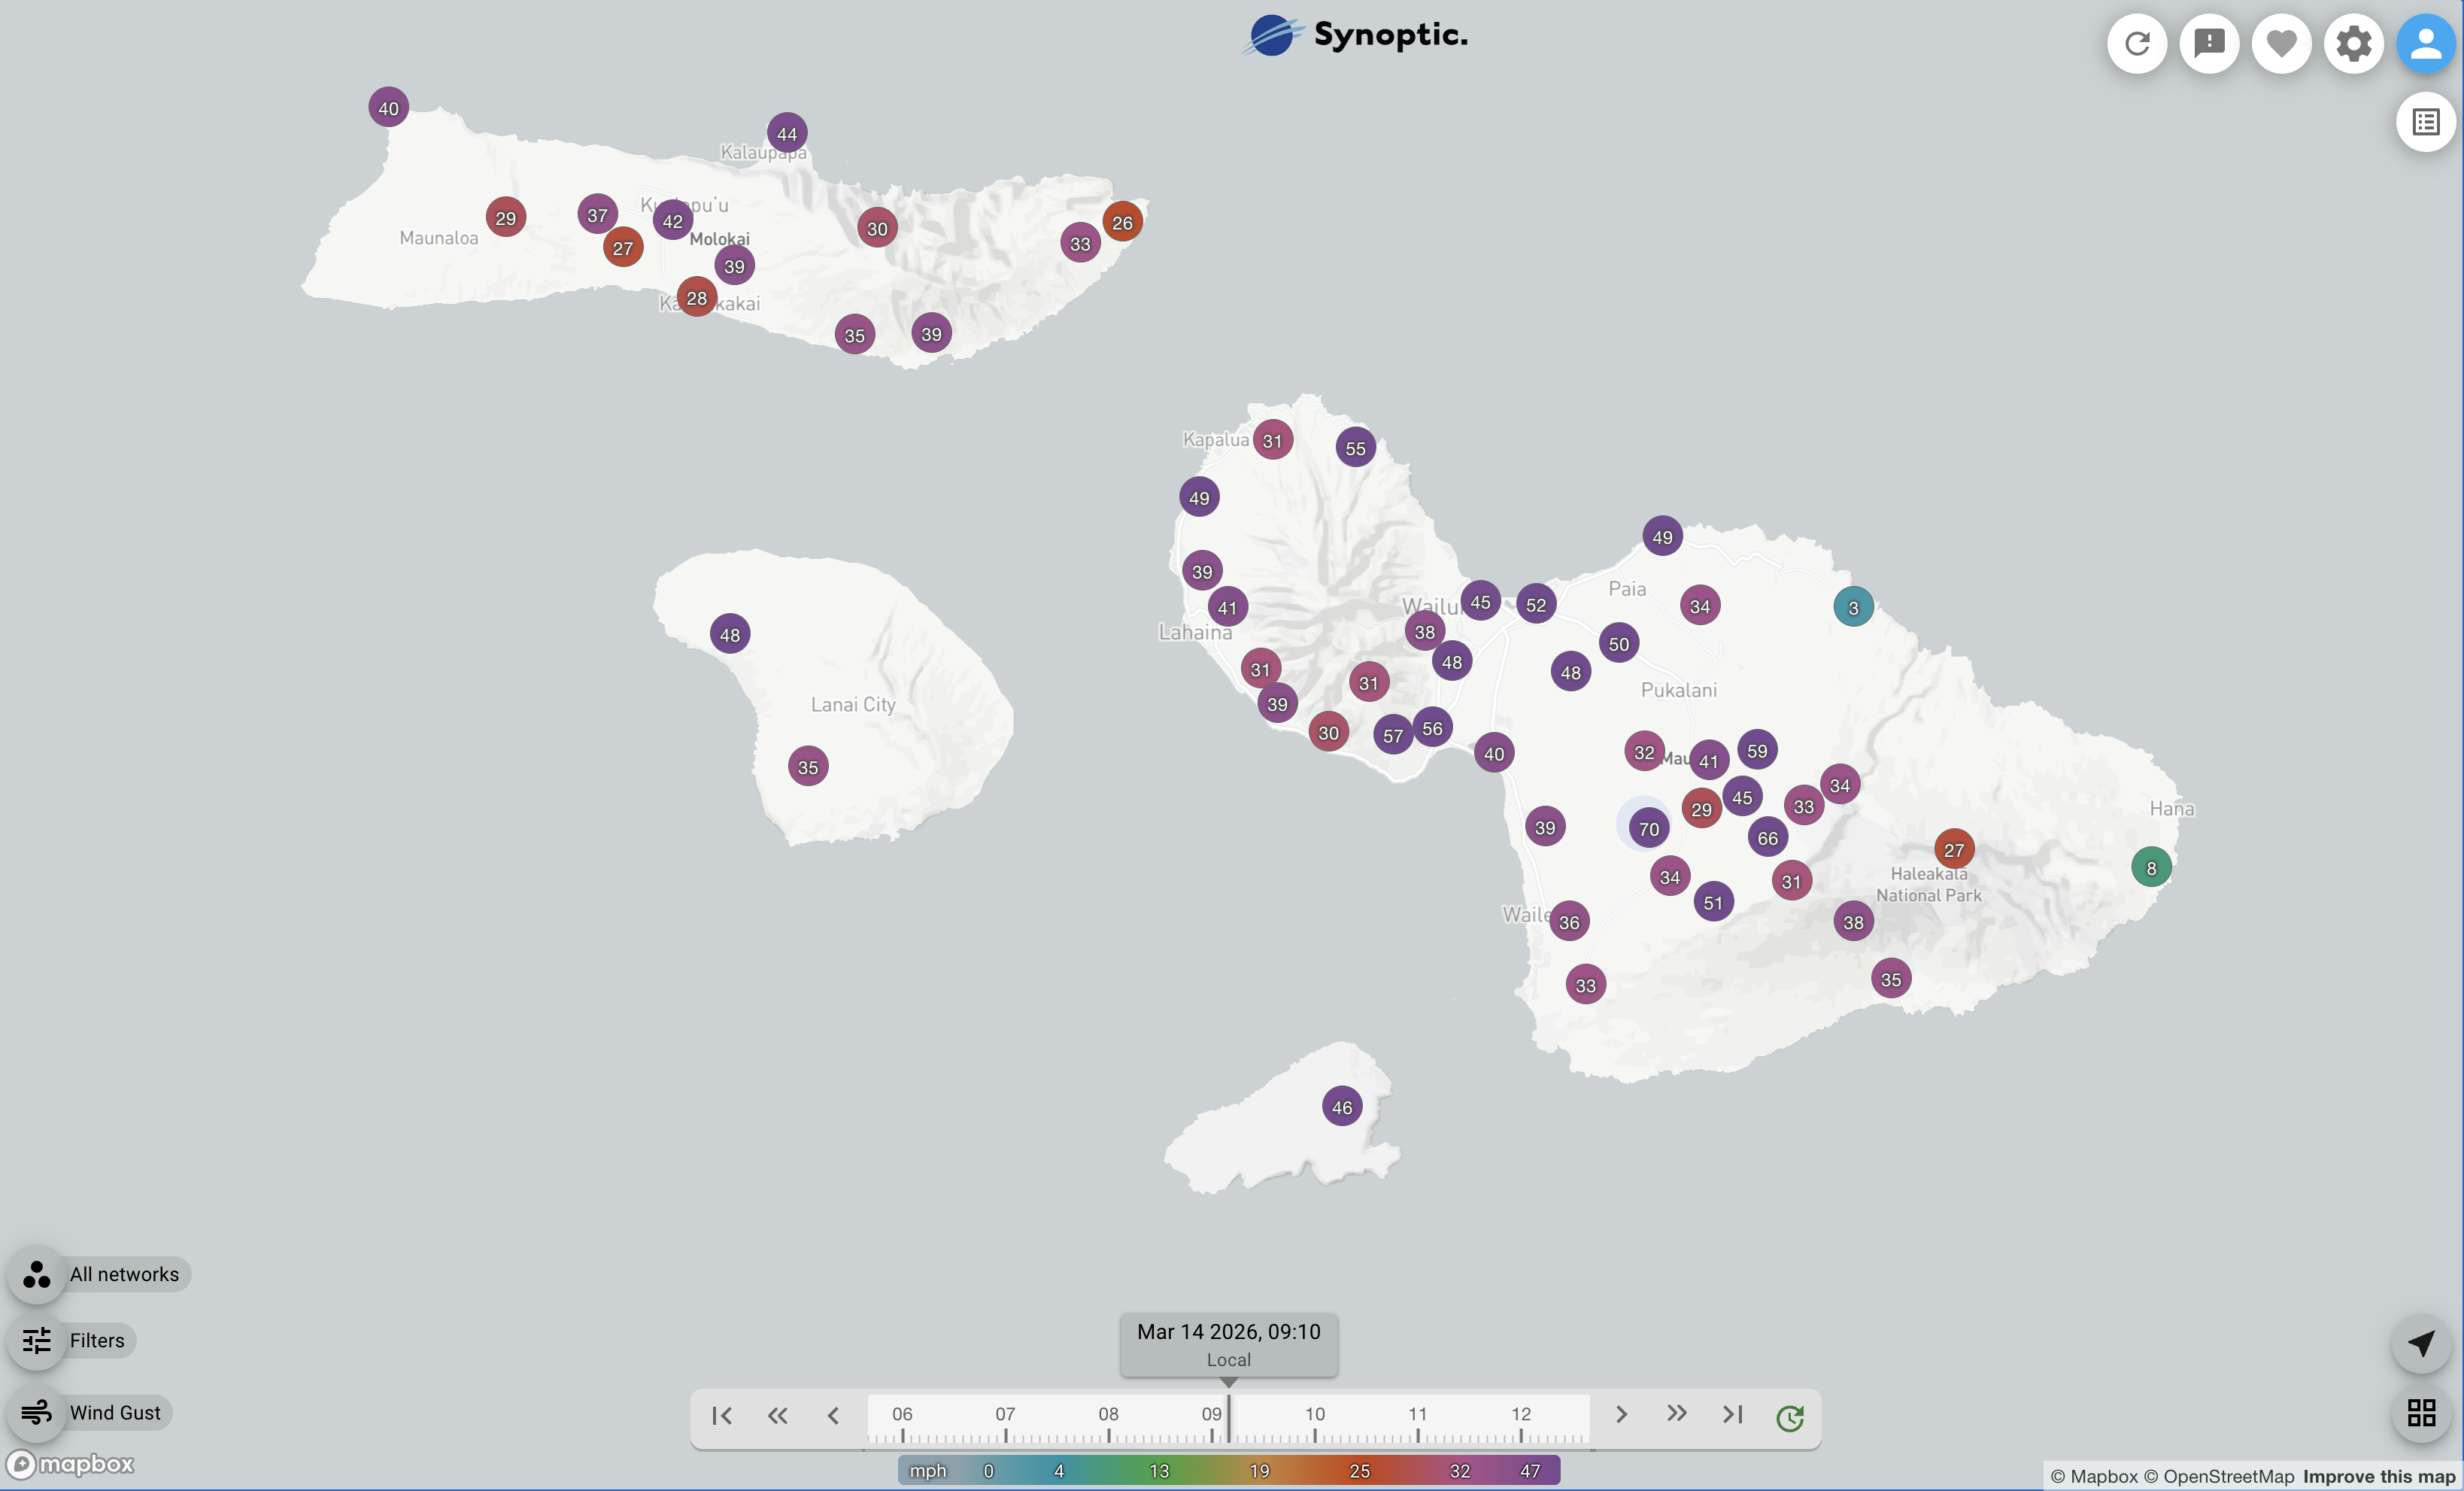
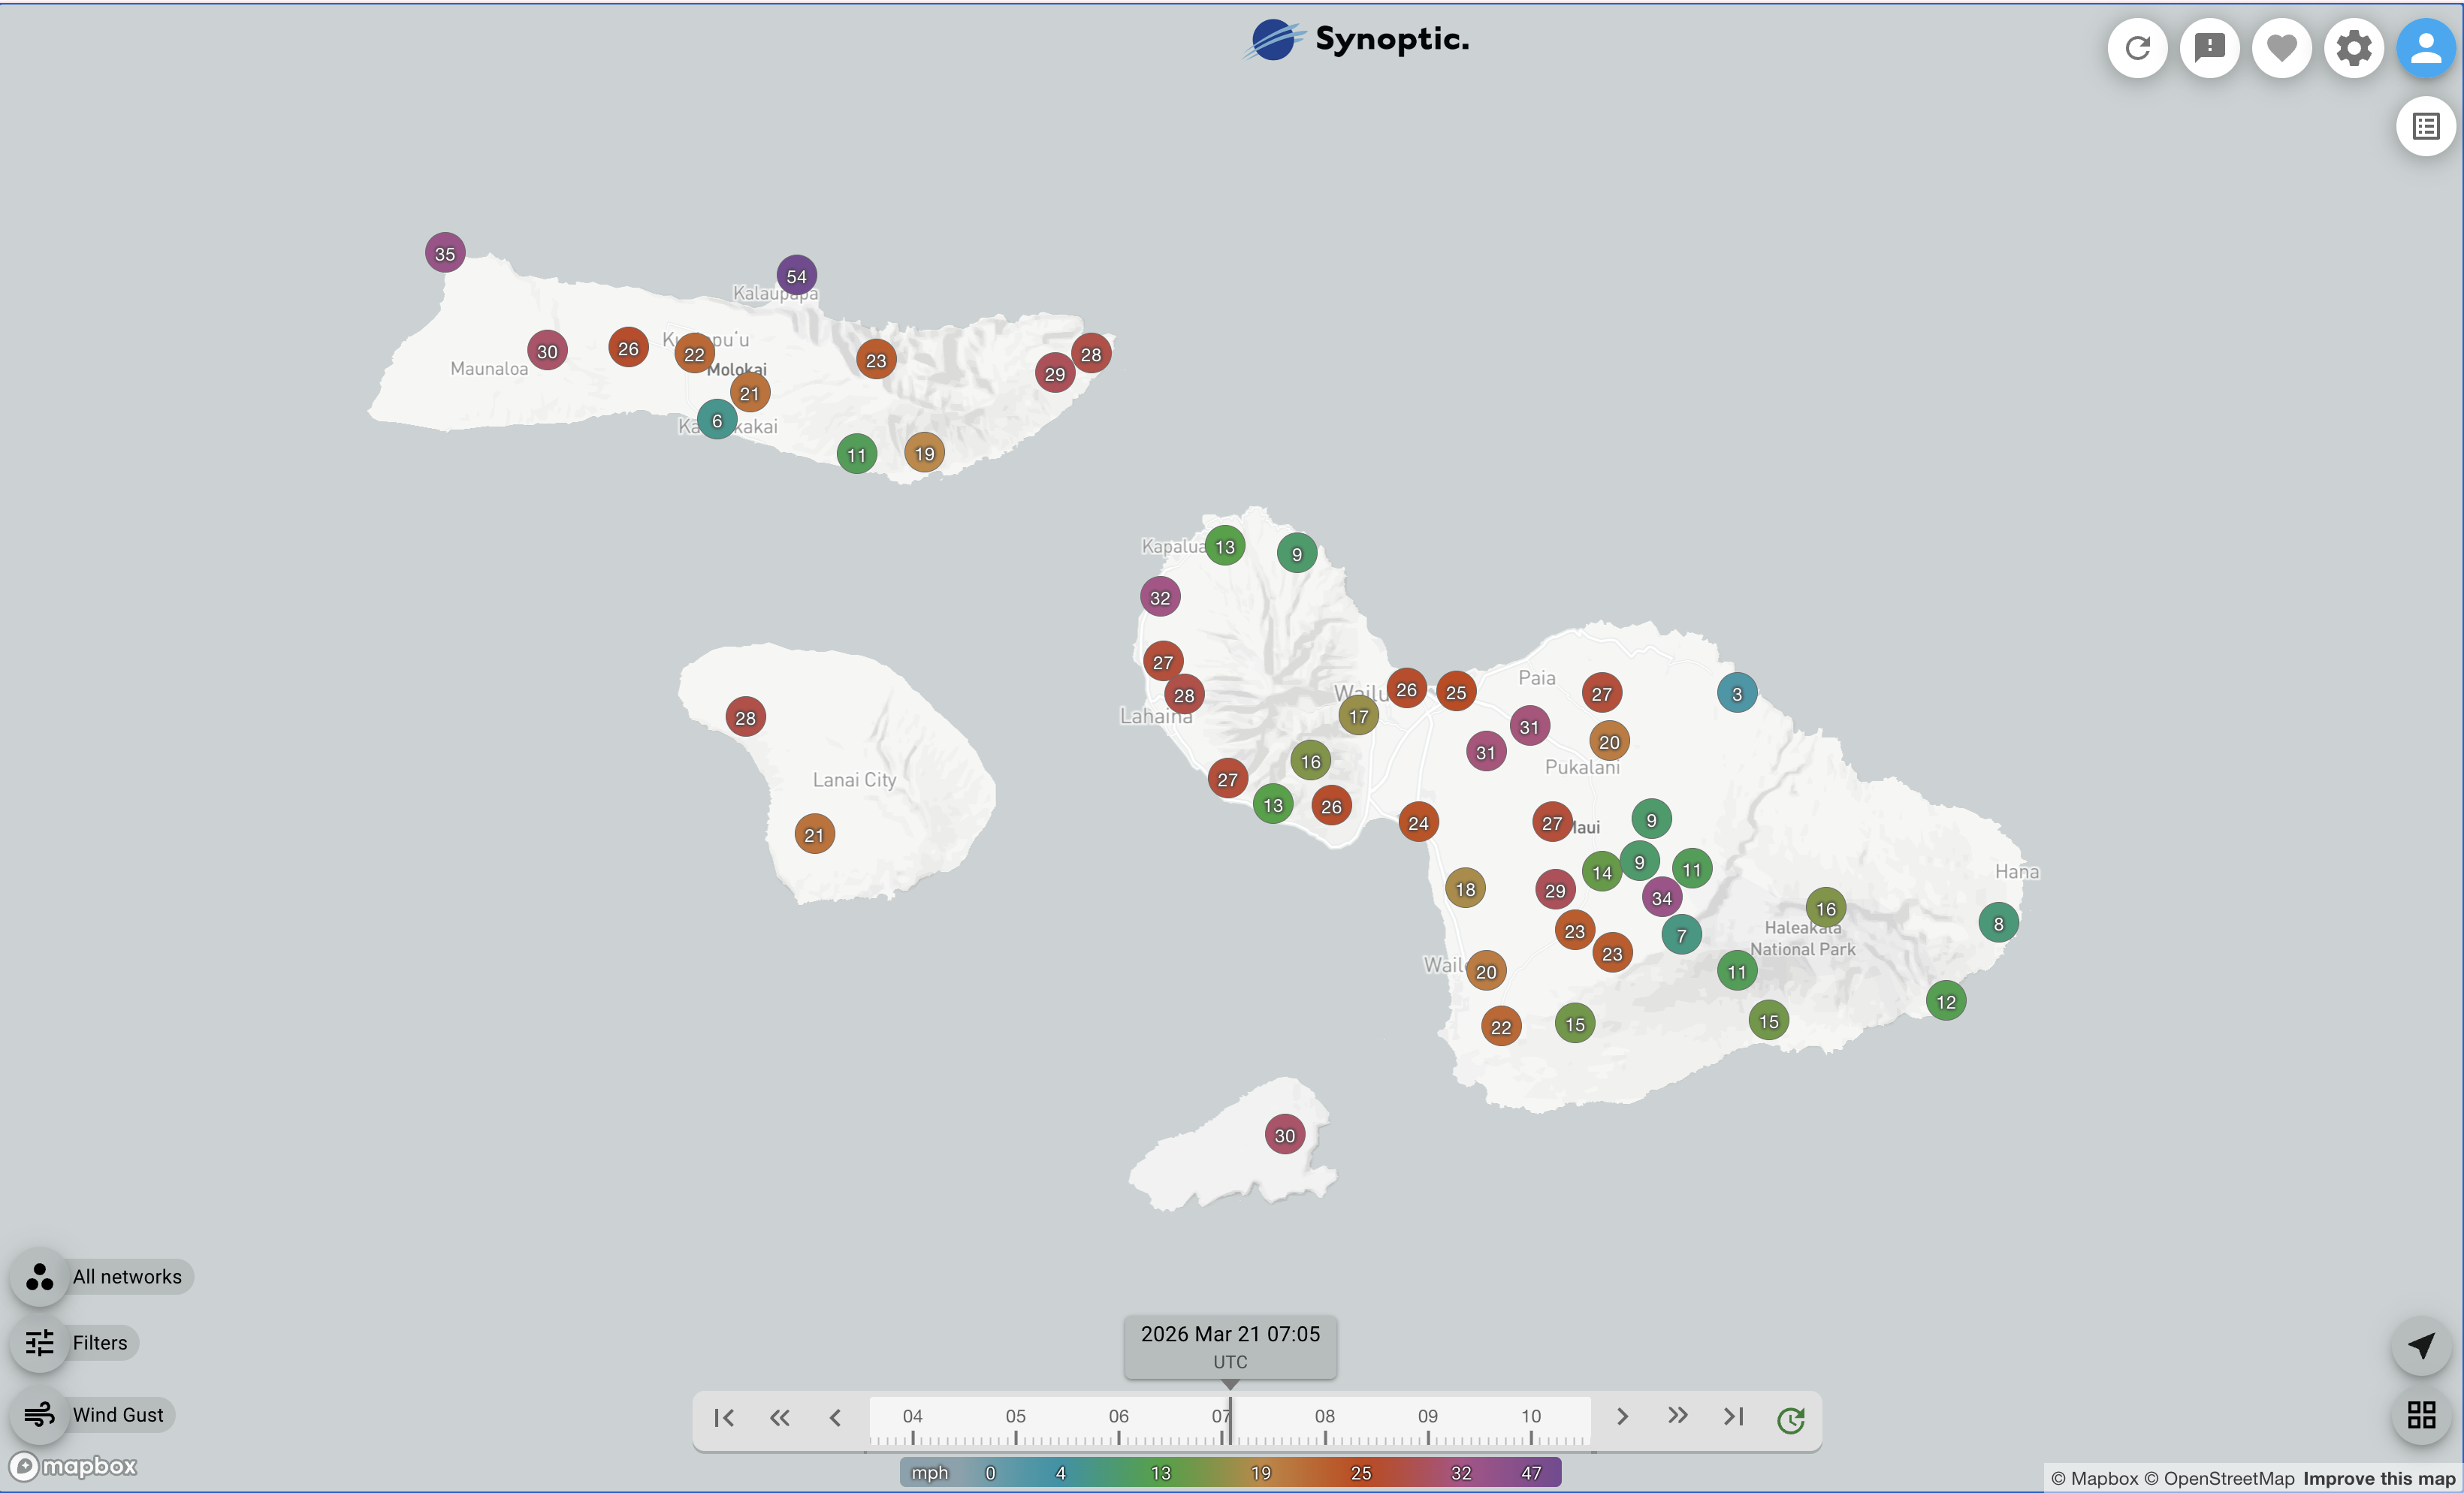
🛜 In case of low connectivity, we have linked a screenshot of the wind gusts in miles per hour (mph) in Maui Nui on March 14th, some of the highest recorded in the storm.
ℹ️ This interactive map shows total rainfal in inches in Maui Nui (and Hawaii if you zoom out) from March 18th, 2026 through March 24th.
🔍 To see individual stations, zoom in, click on the station ↖️. Then, select "Display Conditions," and the "Precipitation" button for graphs of the total rainfall over time. Here's an example graph:
🛜 In case of low connectivity, we have linked a screenshot of the total rainfall in Maui Nui from March 18th, 2026 through March 24th.
🛜 In case of low connectivity, we have linked a screenshot of the wind gusts in miles per hour (mph) in Maui Nui on March 20 at 21:15 (HST), some of the highest recorded in the storm on Moloka'i.
ℹ️ While Moloka'i experienced highest wind gusts on March 20 at 21:15 (HST), Kula on Maui experienced the highest wind gusts on March 20 at 8:26AM (HST) with gusts up to 48 mph. You can explore the wind gusts in Kula and other locations on the interactive map.
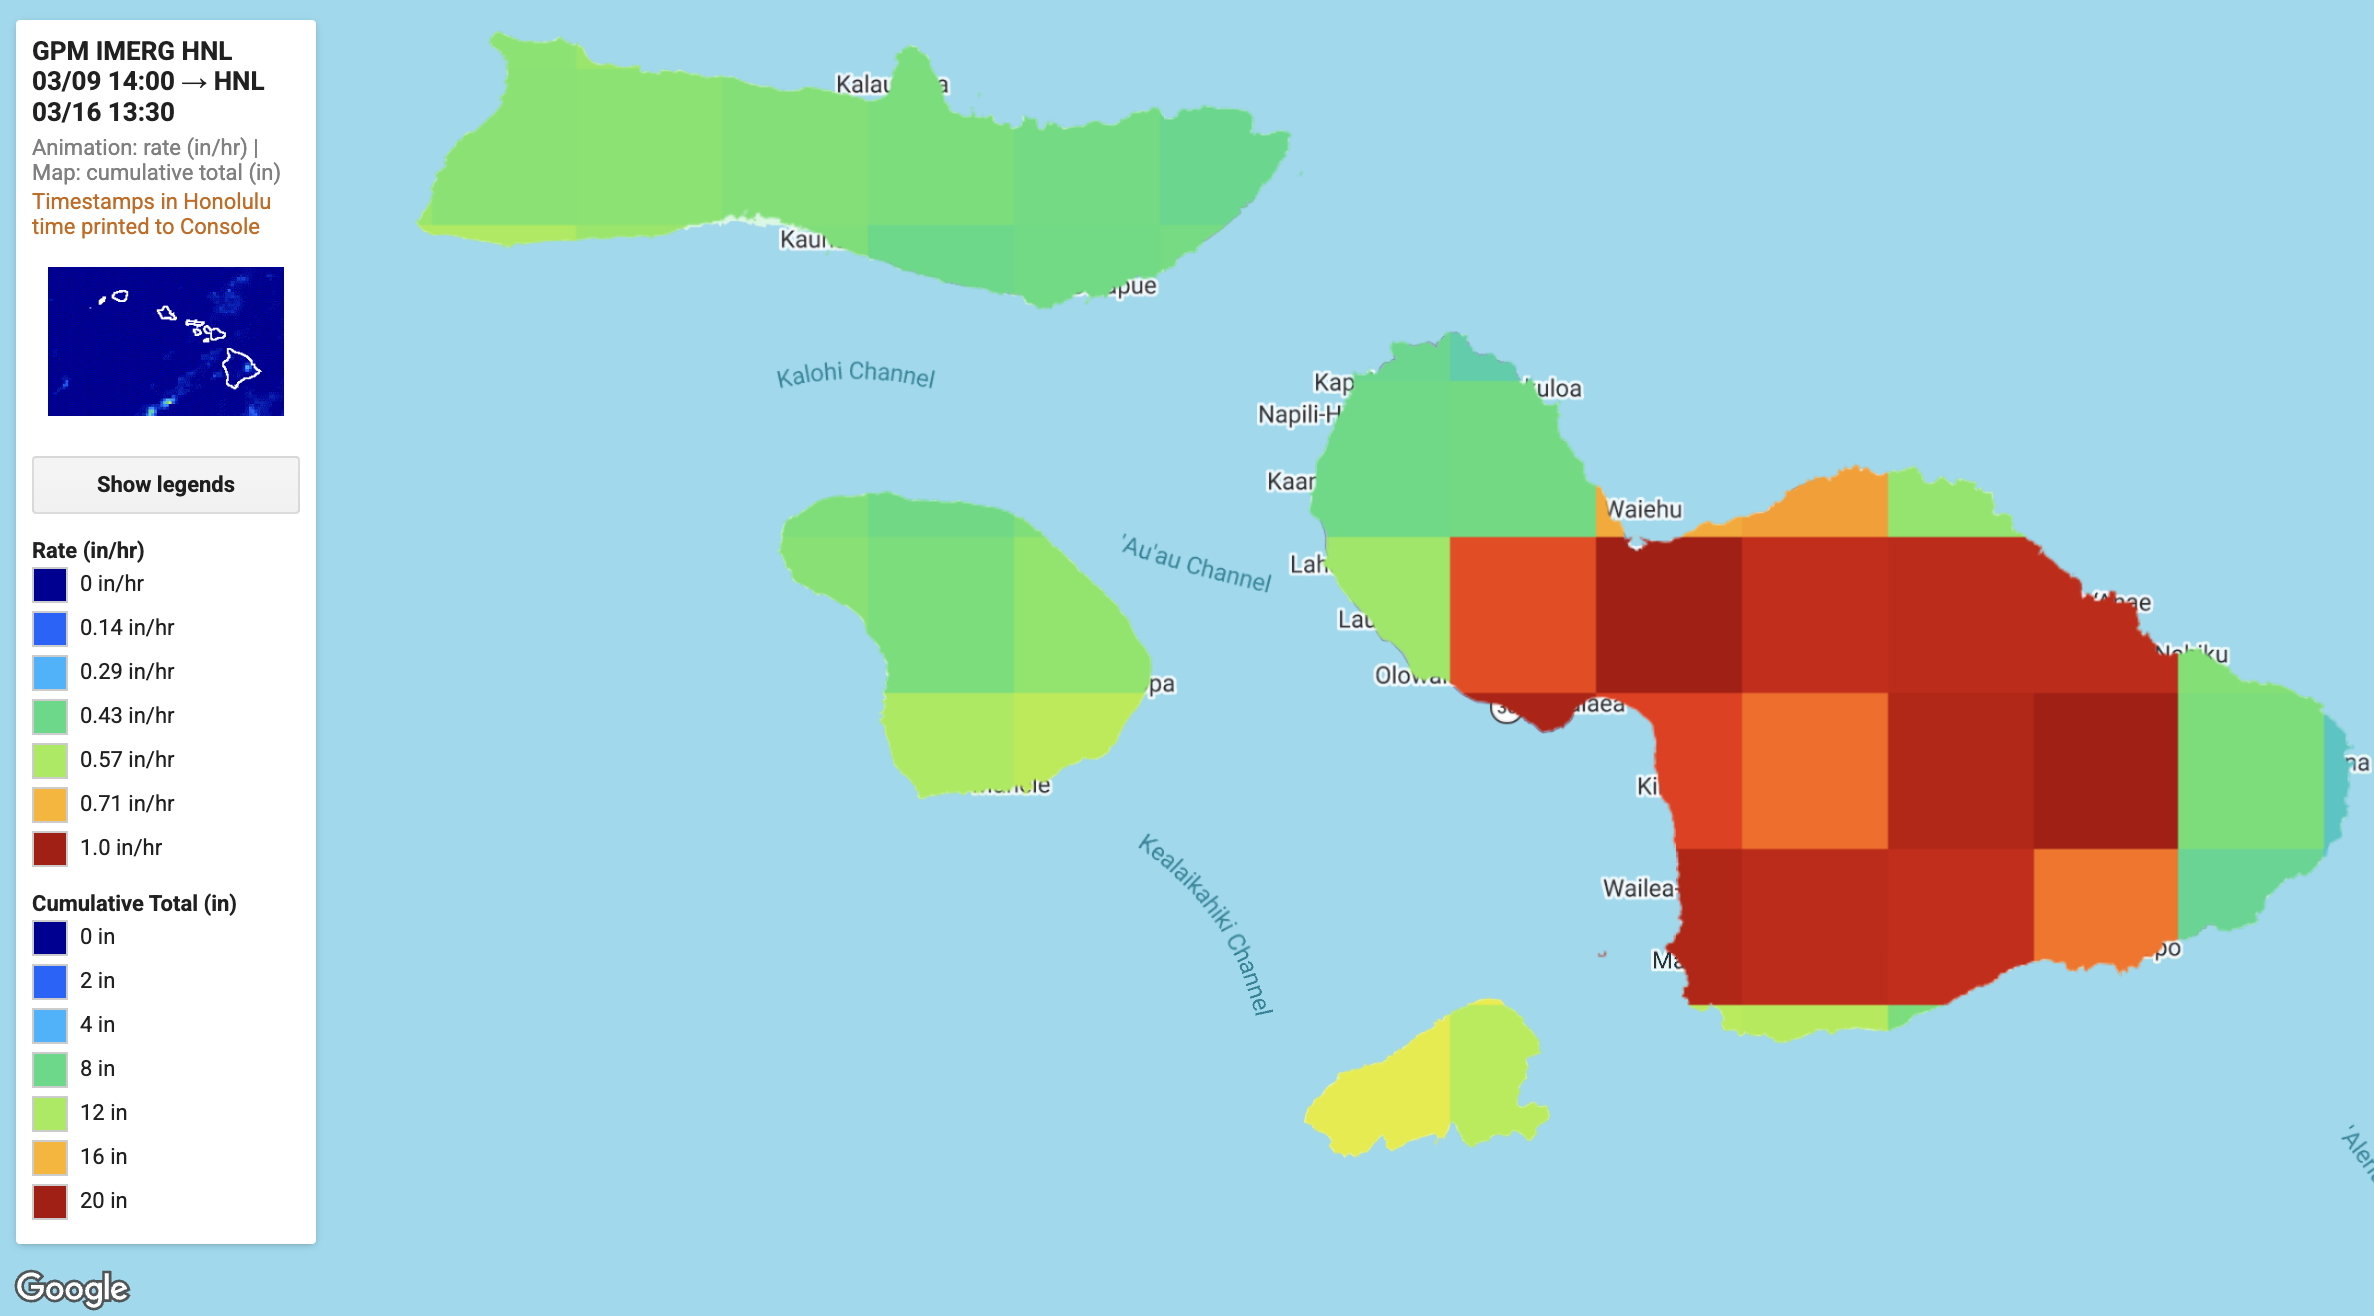
ℹ️ Use the animation to track rainfall intensity over time; red areas indicate the highest rates (over 1 in/hr).
Credit: Arizona State University/NASA Acres Team using NASA GPM IMERG data.ℹ️ This interactive map allows you to see the estimated total rainfall in inches (in) from the first Kona Low Storm using GPM IMERG data. 📈Click anywhere on the map to see a local time series of rainfall rate (in/hr) and total accumulated rainfall (in) from March 9th through March 16th.
⚠️ Note that this data has not been bias-corrected yet and represent larger areas than the ground-based measurements so the total precipitation during intense rainfall may be underestimated.
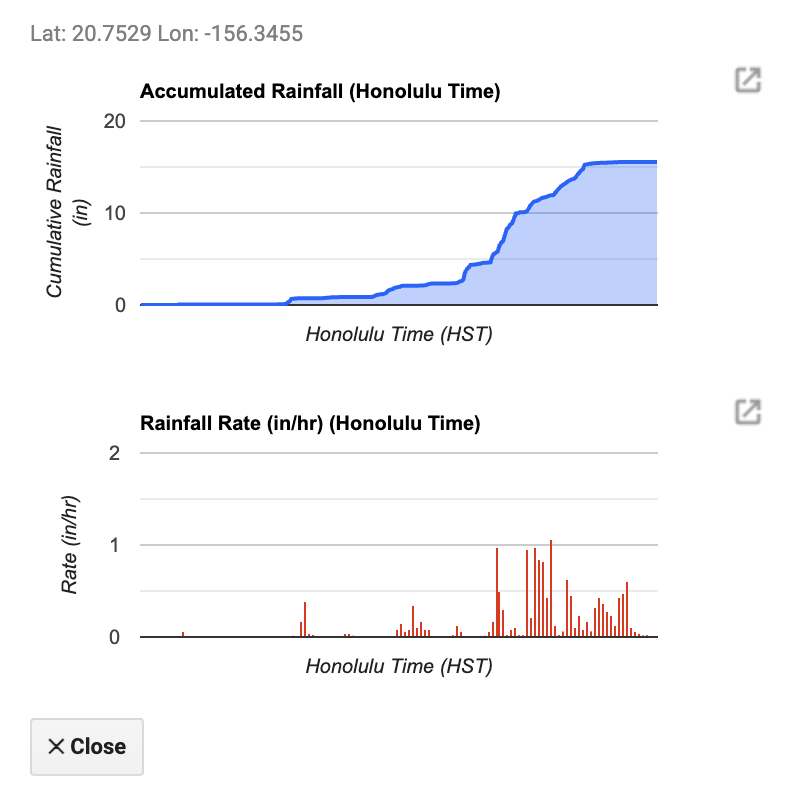
🛜 In case of low connectivity, we have linked a screenshot of the accumulated rainfall (inches) in Maui Nui from March 9th to the 16th.
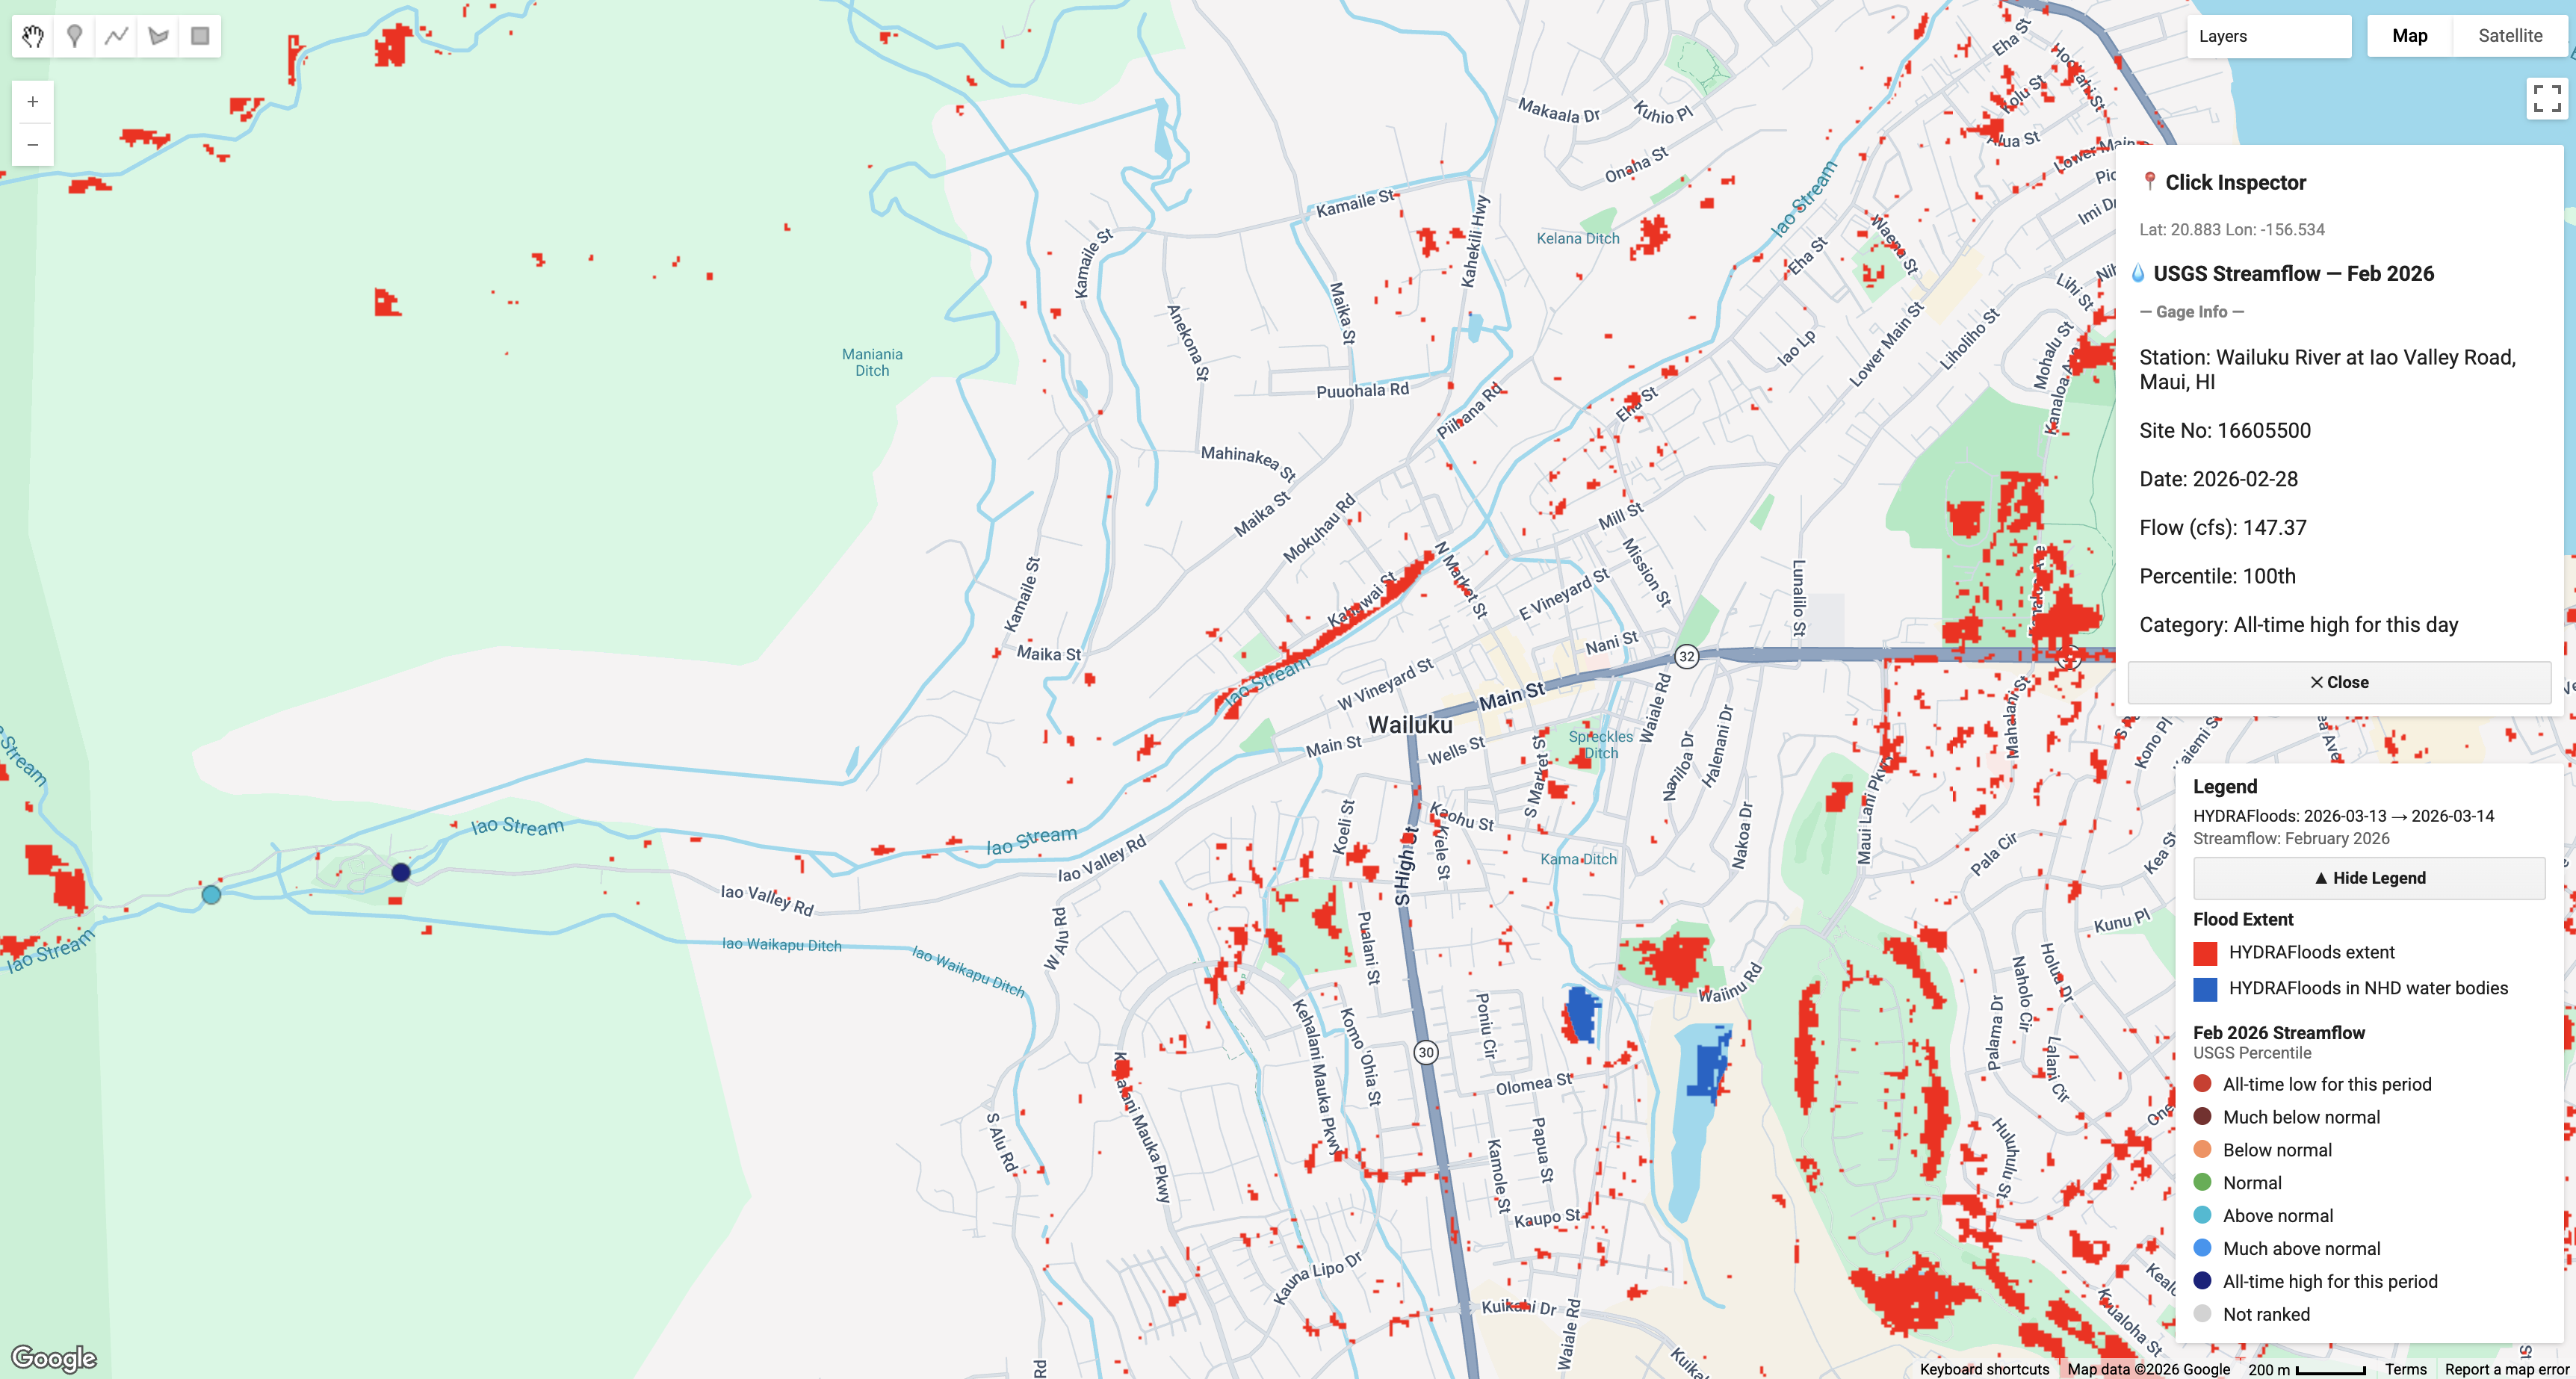
ℹ️ This interactive map shows the estimated flood extent across Maui Nui from March 13-14 based on NASA SERVIR HYDRAFloods modeling tools. Areas shown in red indicate locations where flooding was detected after filtering out permanent water bodies and pre-existing wet areas. USGS streamflow conditions from February 2026 are also shown to provide context on how wet conditions leading up to the storm may have influenced flooding. Areas shown in blue represent water detected by HYDRAFloods within mapped reservoirs, which may reflect elevated water levels rather than flooding.
⚠️ These flood estimates are based on a limited time window and have not been fully validated. As a result, they may underestimate the true extent and impacts of flooding, particularly in areas with short-lived or rapidly changing conditions.
🛜 In case of low connectivity, we have linked a screenshot showing the estimated flood extent from March 13–14, including areas of detected flooding and water within mapped water bodies.
🔍 To explore the map, zoom in and ↖️ click on a stream gauge. A panel will appear showing streamflow conditions and additional information for that area. Use the legend to toggle visibility of flood extent and streamflow categories.
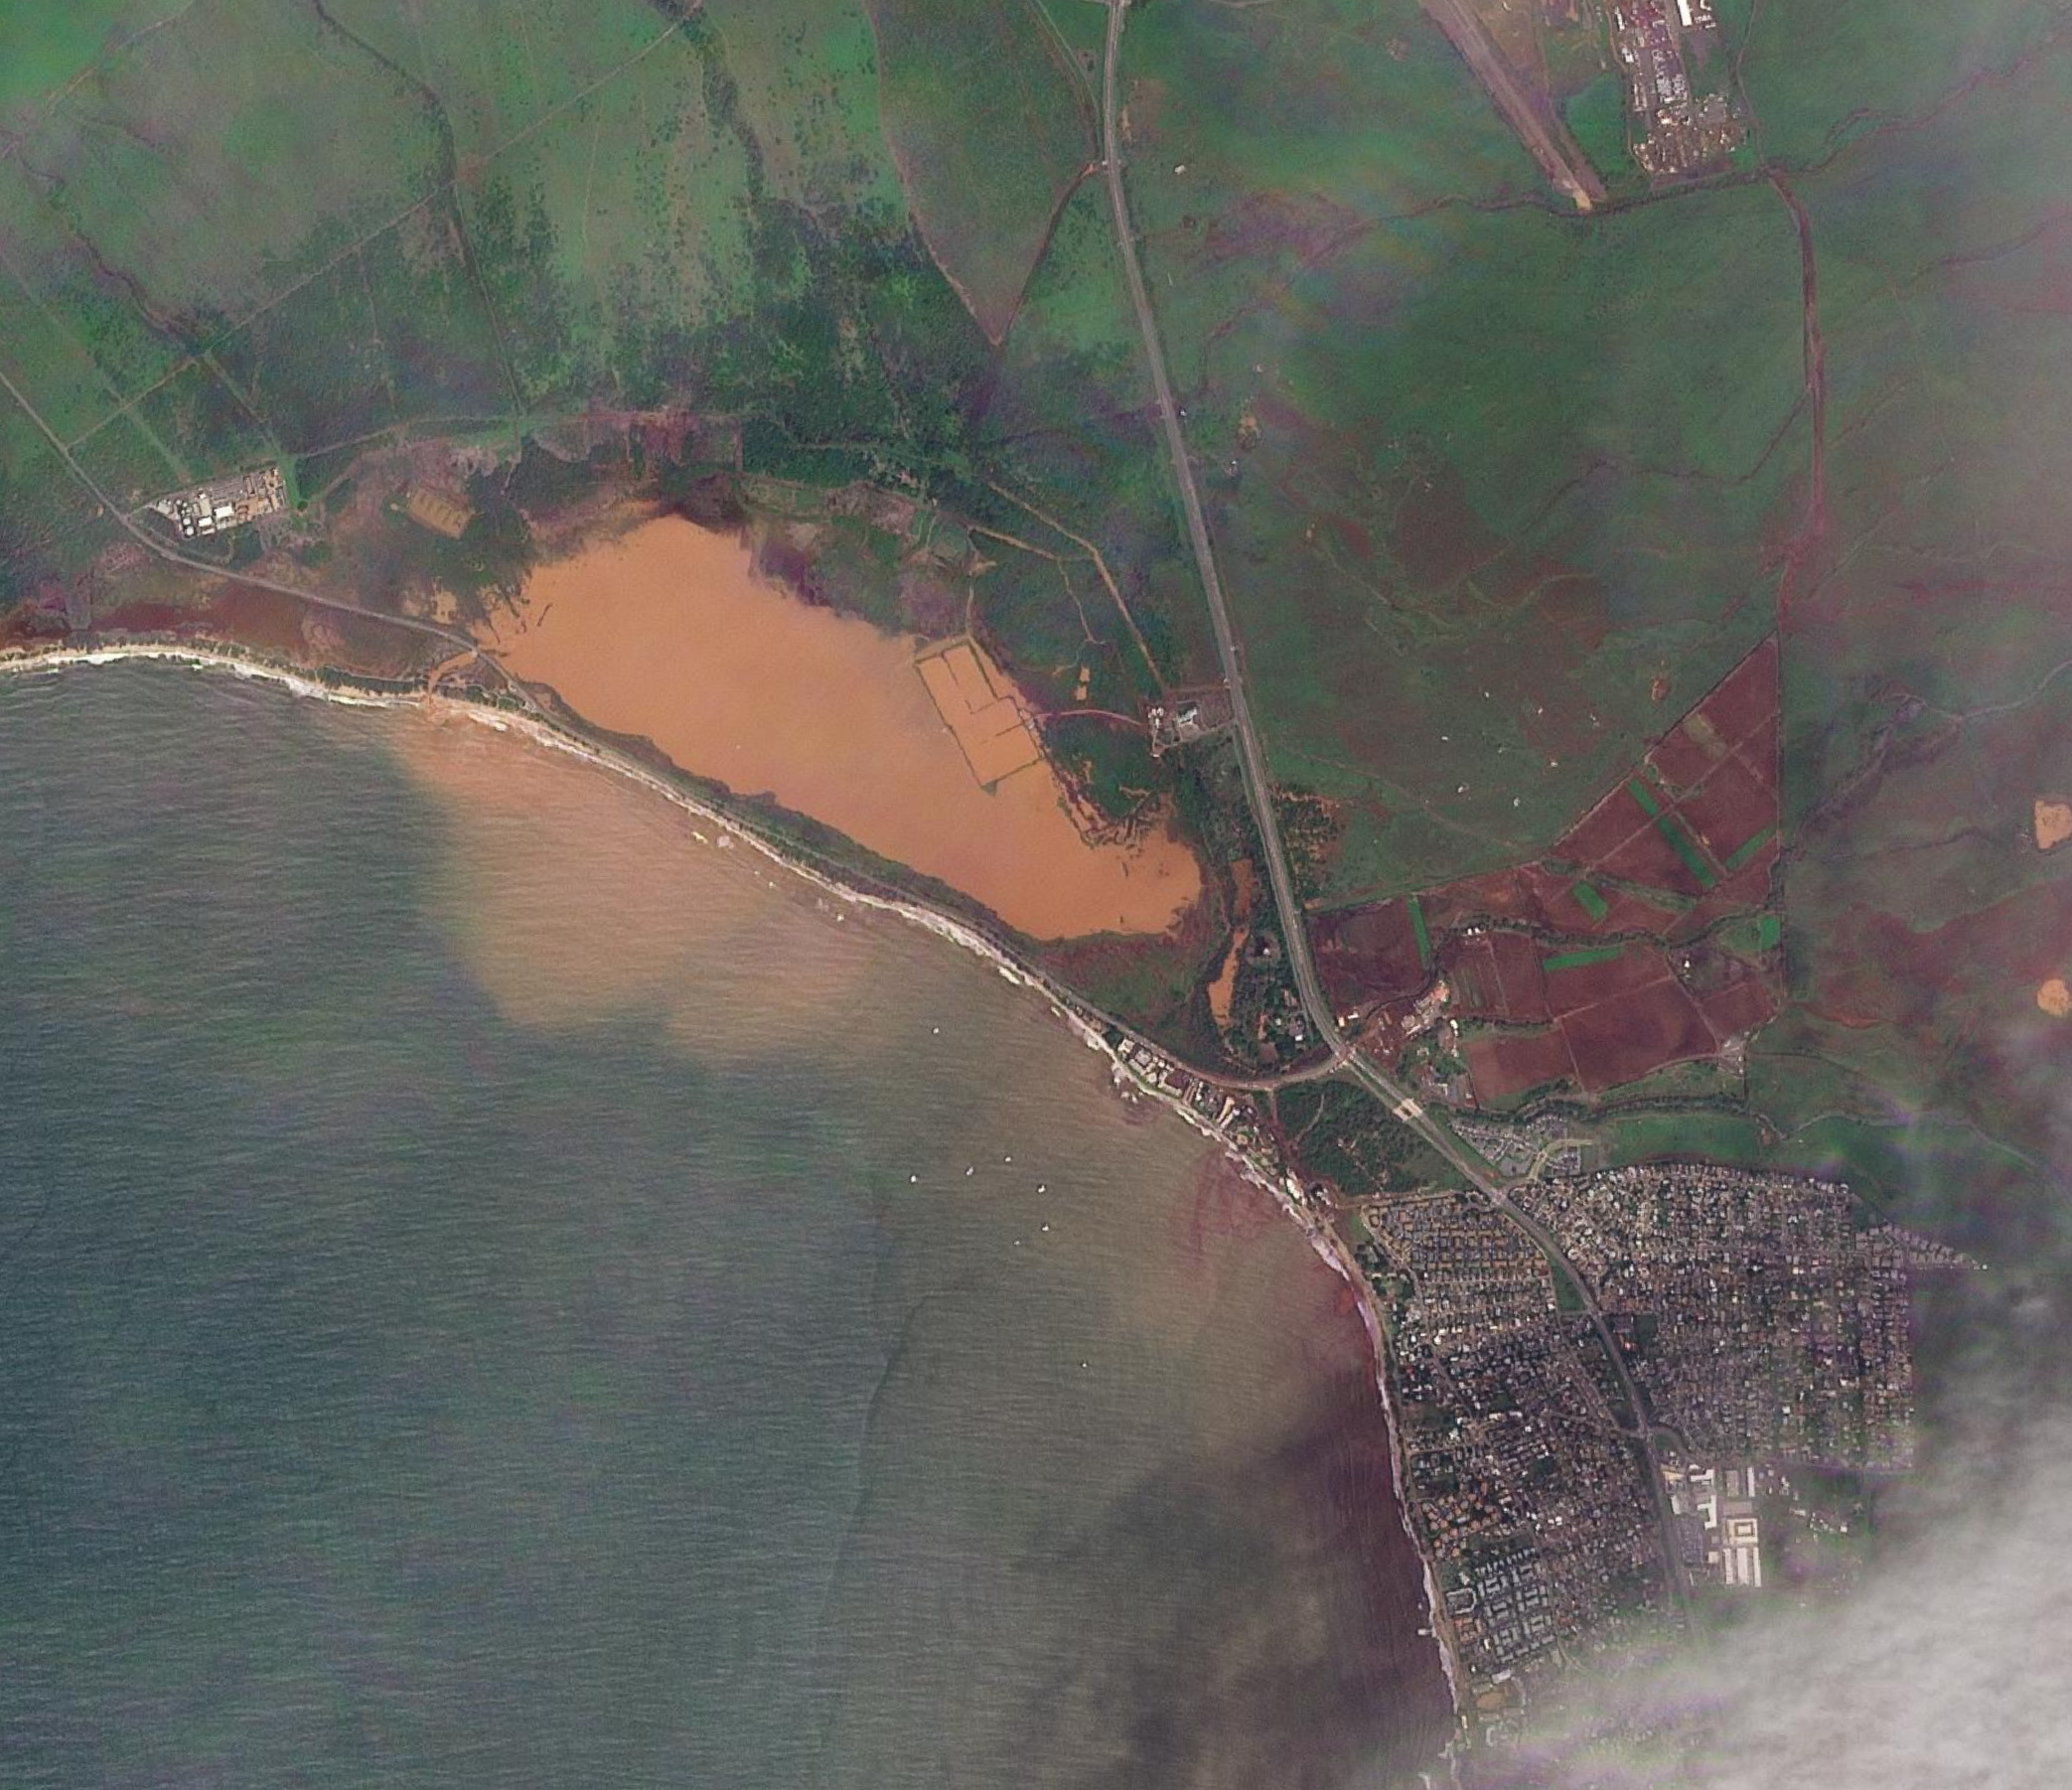
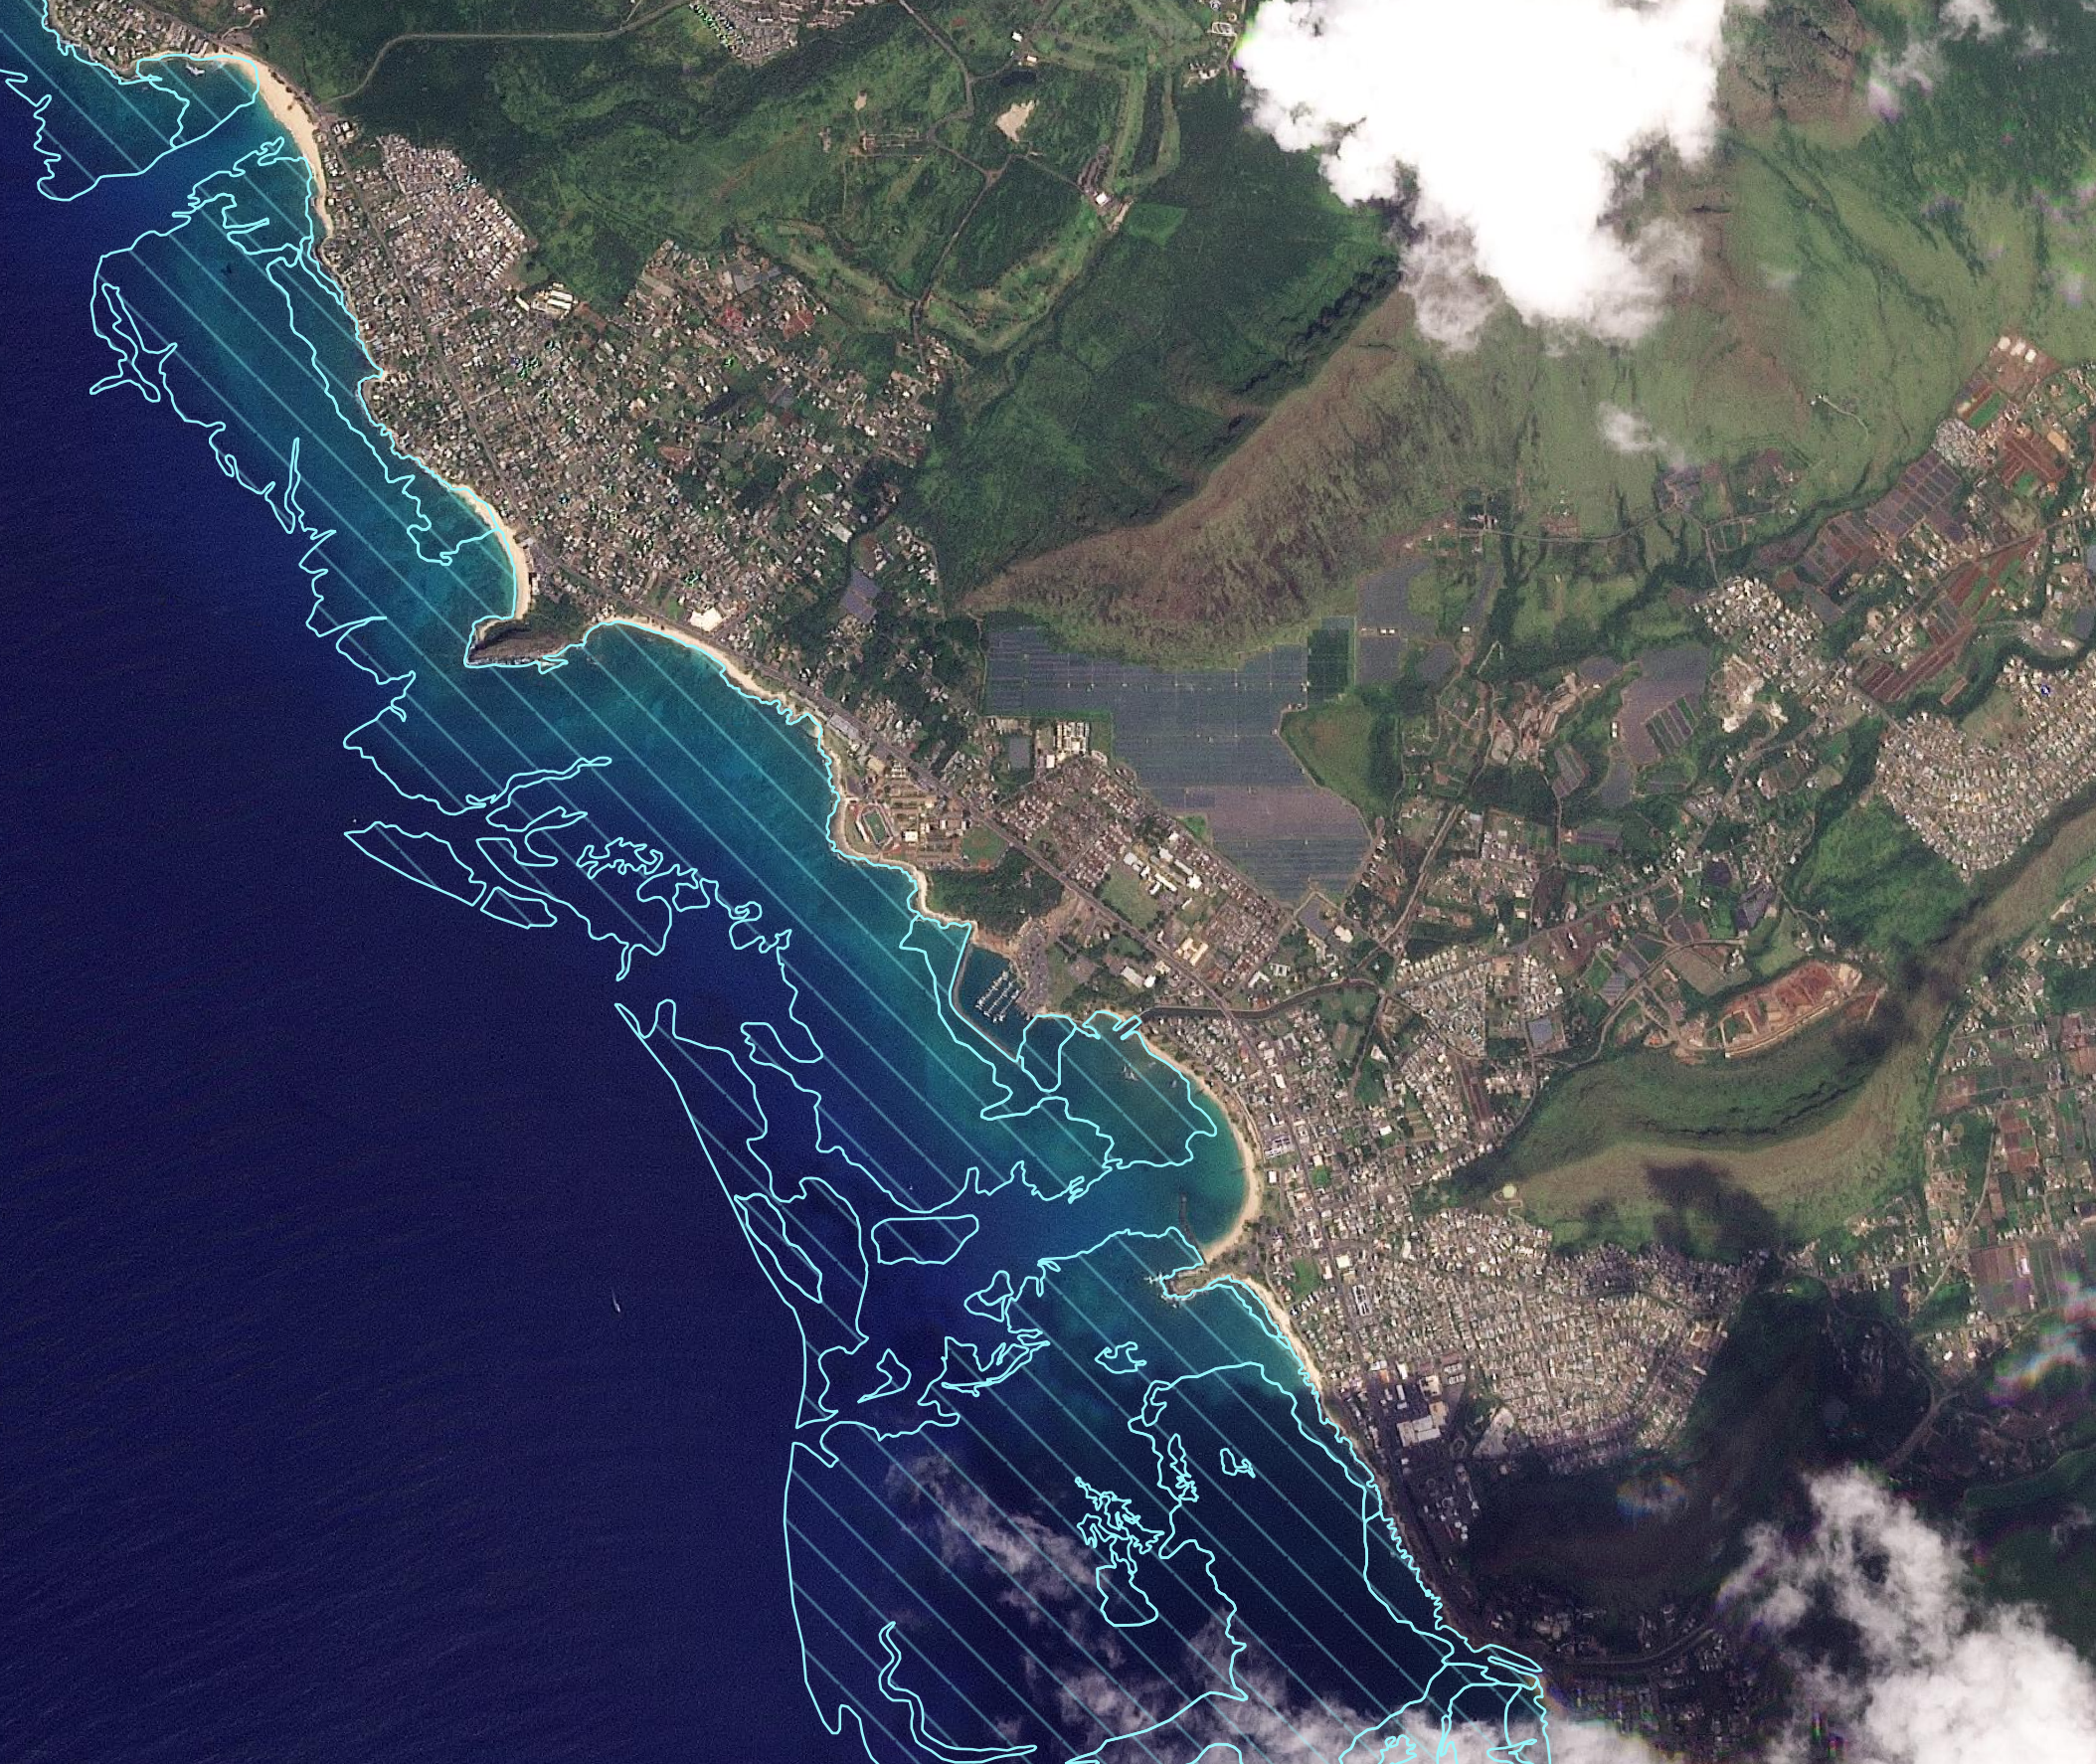
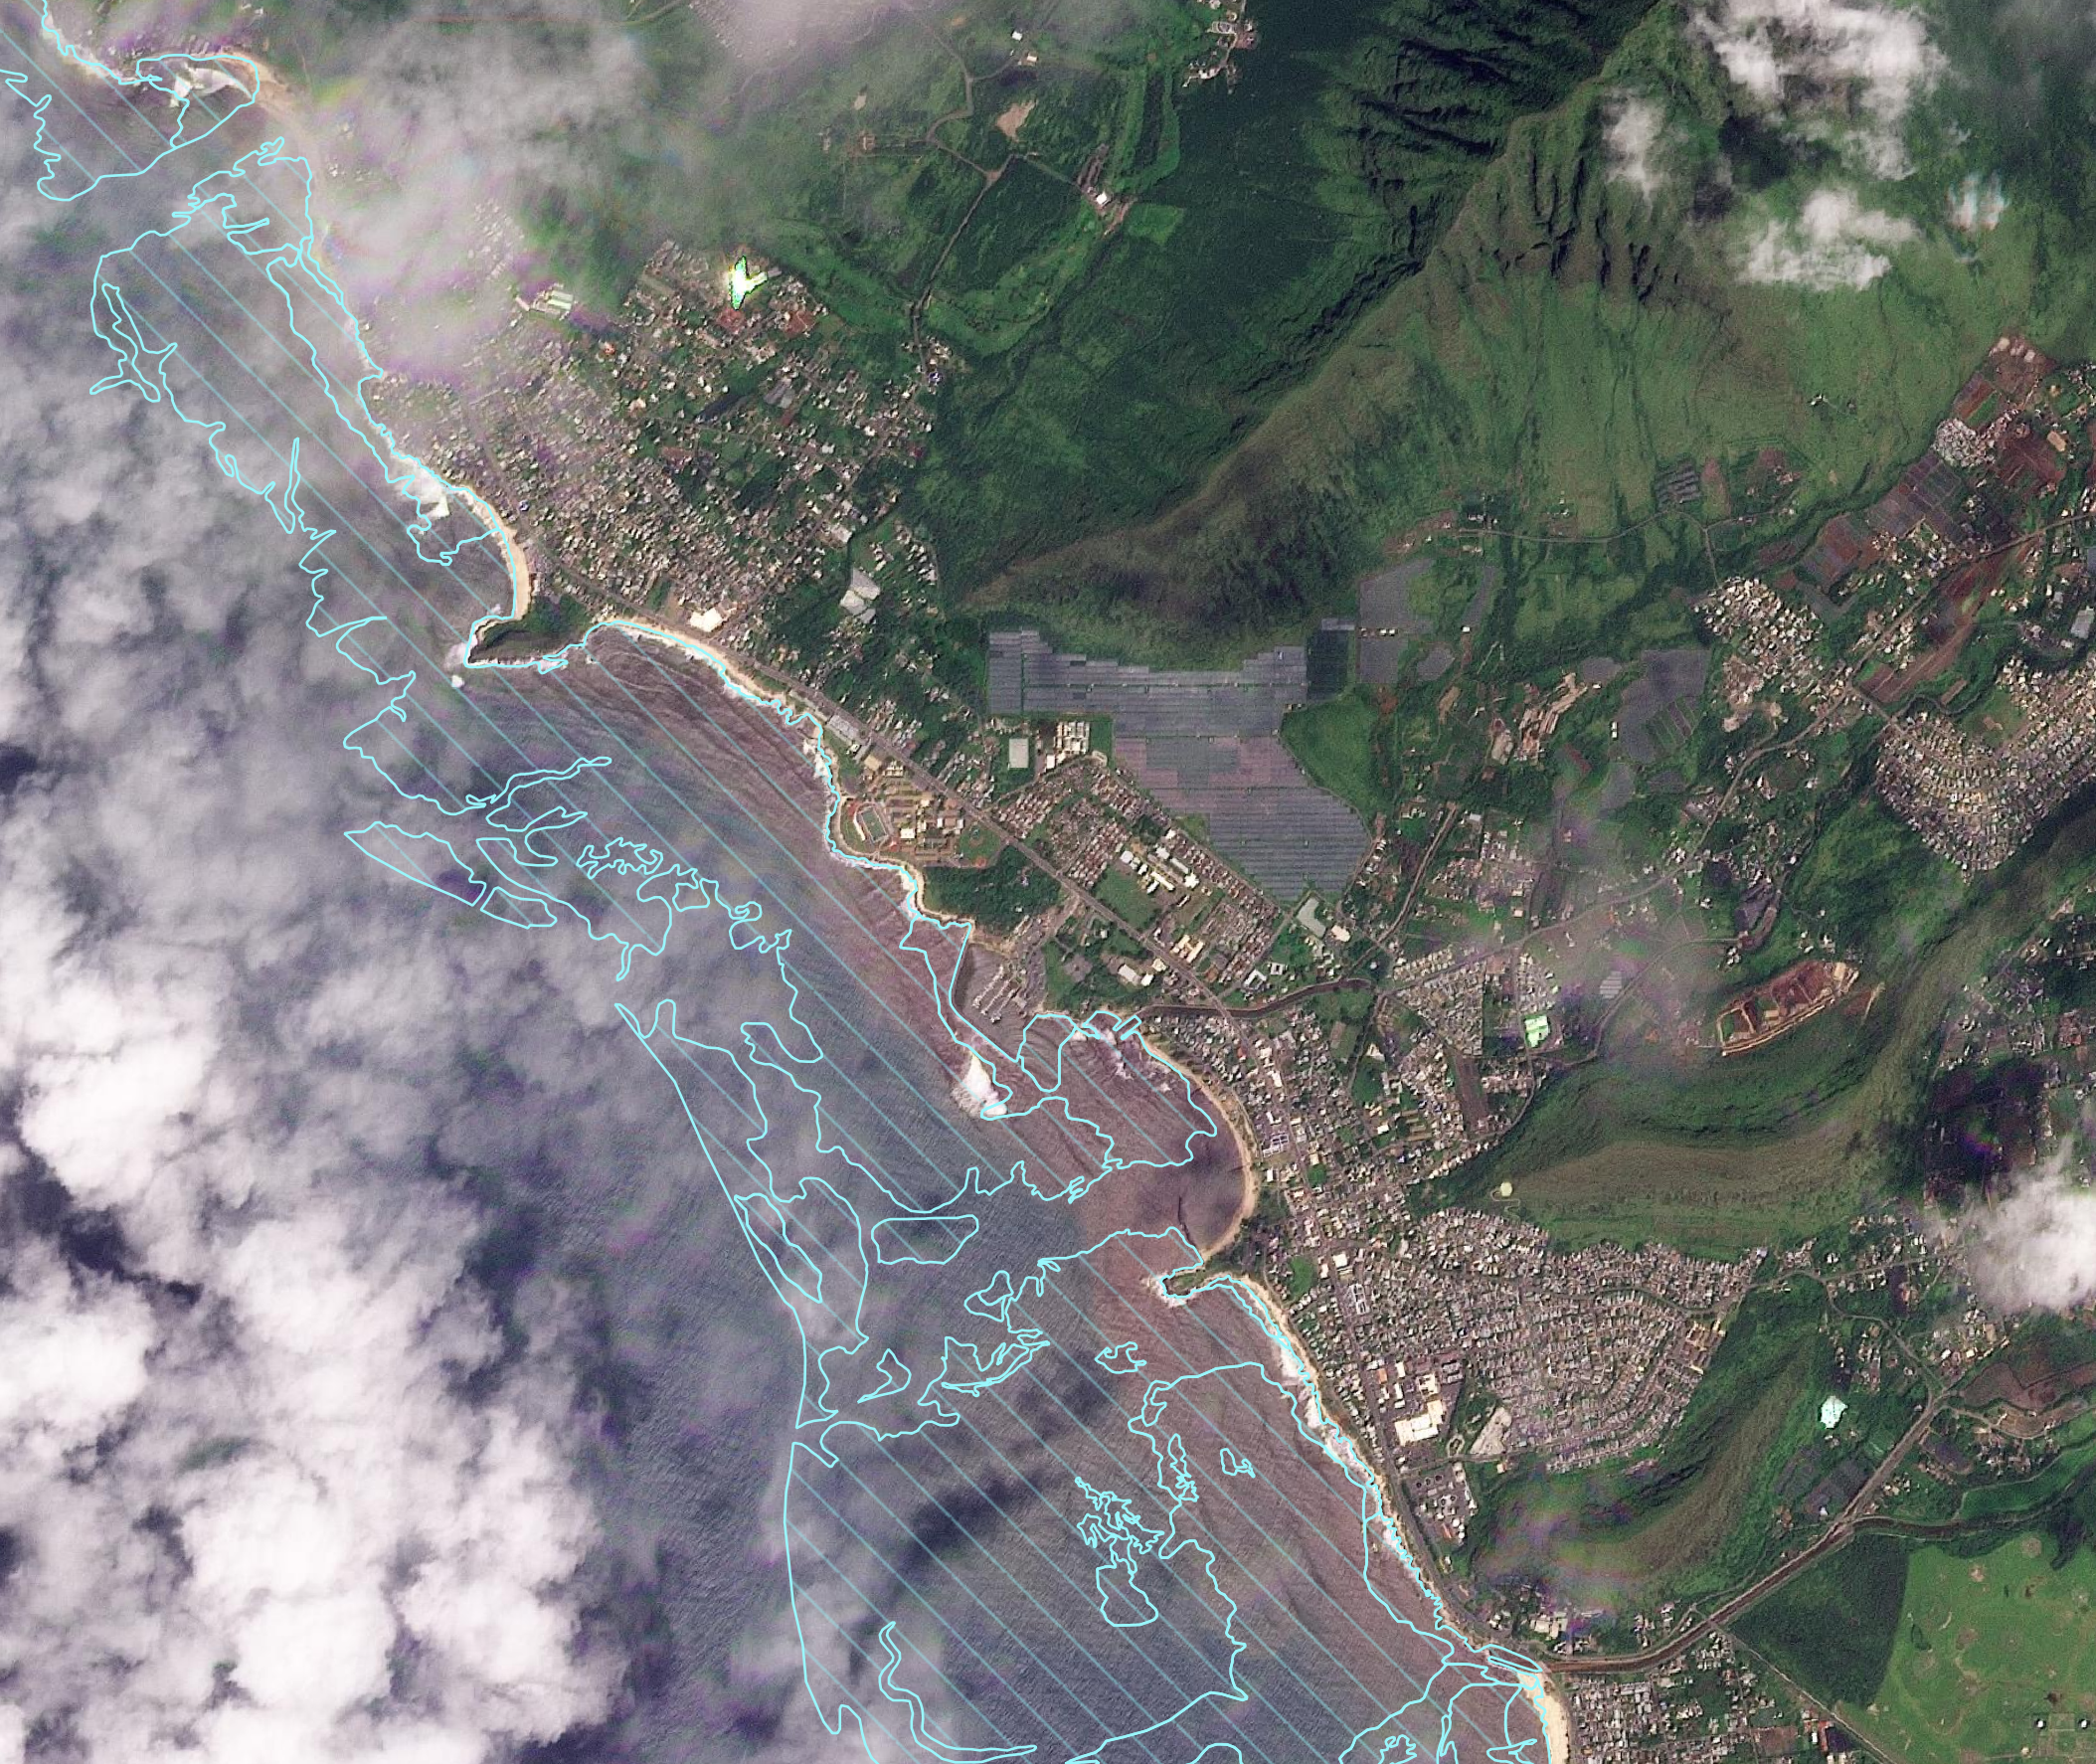
ℹ️ This slider compares PlanetScope imagery before and after the storm to highlight coastal runoff. The left image shows conditions on March 22, 2026 at 11:43 AM (HST), while the right image shows conditions on March 6, 2026 at 11:38 AM (HST) at Pokai Bay. Discolored nearshore waters indicate sediment and freshwater entering the ocean from land.
The cyan overlay shows mapped coral reef and hardbottom benthic habitats from Hawaii Statewide GIS Program.
🔍 Drag the slider (blue circle) to compare changes and identify impacted coastal areas.
The NASA DRCS program is developing additional resources to characterize flood impact and risks. Visit the NASA DRCS resources page for high-resolution radar and optical satellite imagery surrounding the flood dates, as well as a landslide hazard nowcast and exposure map.
ℹ️ The Department of Land and Natural Resources has developed and maintains the Hawaii Flood Hazard Assessment Tool (FHAT). The FHAT is an informational map viewer that displays FEMA’s Geographic Information Systems (GIS) version of the FIRM map. User can search by area of interest, address, TMK number, stream or watershed name, and by a specific Letter of Map Change (LOMC).